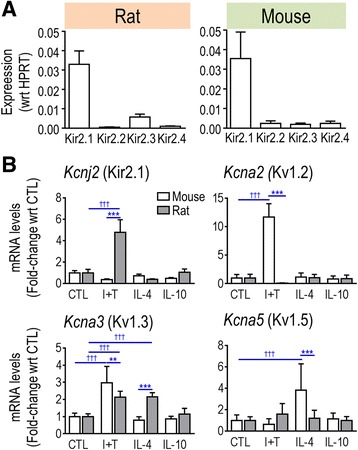
Fig. 7.

K+ channel transcript expression rat and mouse microglia were unstimulated (CTL) or stimulated with IFN-γ and TNF-α (I + T), IL-4 or IL-10. a Real-time qRT-PCR analysis of the expression of Kir2 subfamily members in unstimulated rat and mouse microglia (n = 6 individual cultures). b mRNA expression (mRNA counts/200 ng total RNA) was determined by NanoString and expressed as fold change relative to unstimulated control cells (mean ± SEM; n = 4–6 individual cultures). **p < 0.01; ***p < 0.001
