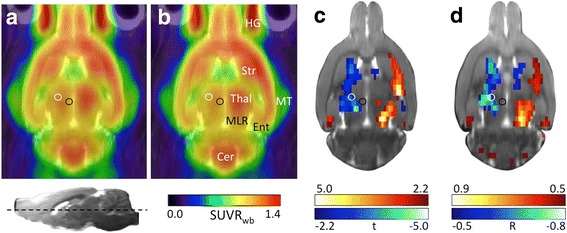
Fig. 2.

[18F]FDG imaging in 6-OHDA- and sham-injected rats. Horizontal views of average [18F]FDG images of sham- (a) and 6-OHDA-injected rats (b). Images with injections on the right side were flipped so that all injections are displayed on the left. The white circle shows the location of the implanted guide cannula for the stimulation electrode (electrode was not inserted in this study). The black circle shows the 6-OHDA or saline injection site. The horizontal section plane is indicated in the lower left corner. c Subtractive t-map (p < 0.05, TFCE-corrected) displaying significant differences between both groups. Red colour shows voxels where [18F]FDG accumulation was higher in 6-OHDA rats compared to shams. Blue voxels indicate a lower [18F]FDG accumulation in 6-OHDA rats compared to shams. d R-map (p < 0.05, TFCE-corrected) showing significant correlation between glucose metabolism and dopamine depletion severity. Red: voxels with positive correlation, i.e. [18F]FDG accumulation increases with increasing depletion severity. Blue: voxels with negative correlation, i.e. [18F]FDG accumulation decreases with increasing depletion severity. Abbreviations: Cer cerebellum, Ent entorhinal cortex, HG Harderinan gland, MLR midbrain locomotor region, MT medial temporal muscle, Str striatum, SUVRwb standardised uptake value ratio with the whole brain as reference, Thal thalamus
