
Fig. 3.
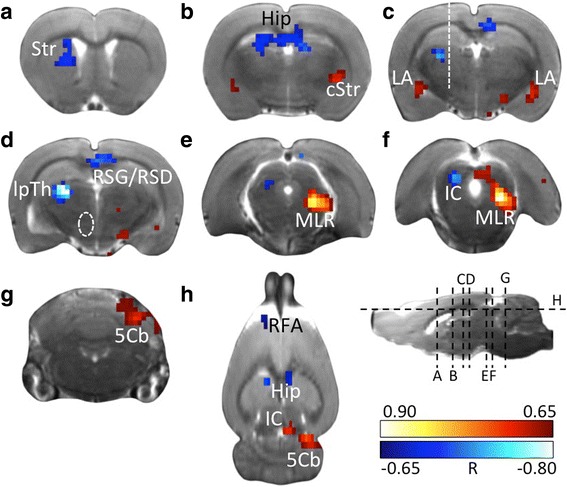
Correlation between lesion severity and brain metabolism. Transverse sections (a–g) and horizontal section (h) showing significant correlation (p < 0.01, TFCE-corrected) between [18F]FDG accumulation and dopamine depletion severity. Section levels are indicated by dashed lines in the sagittal section. White dashed line in c: Location of guide cannula. White dashed line in d: 6-OHDA injection site. Red: voxels with positive correlation, i.e. metabolism increases with increasing lesion severity. Blue: voxels with negative correlation, i.e. metabolism decreases with increasing lesion severity. The colour scale shows the correlation coefficient R. Abbreviations: 5Cb cerebellar lobule V, cStr caudal striatum, Hip hippocampus, IC inferior colliculus, LA lateral amygdala, lpTh lateral posterior thalamus, MLR midbrain locomotor region, RSG/RSD retrosplenial granular/dysgranular cortex, Str striatum