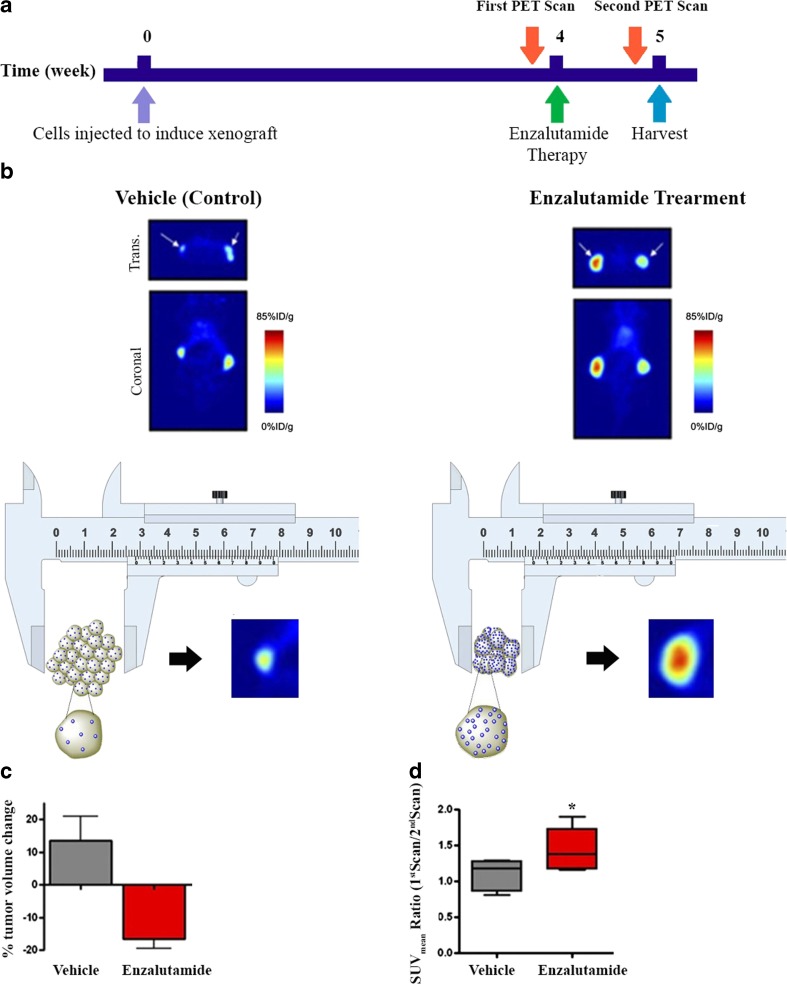
Fig. 2.
Monitoring treatment response using caliper measurements versus PSMA-based imaging. (a) Experiment timeline; (b) PET scans 7 days after enzalutamide therapy (10 mg/kg) versus control group. (c) Percentage change in LNCaP xenografted tumor volumes. (d) The SUVmean ratio of the first PET scan (before ADT) to the second PET scan (after ADT). (Adapted and modified from Ref. [26] with permission)

