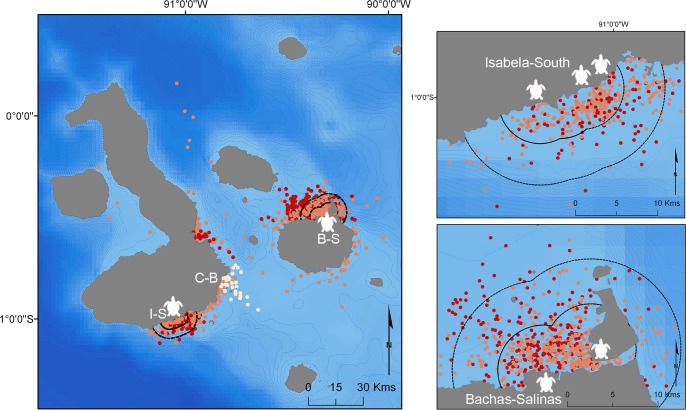
Fig 3. 12-hourly estimated positions provided by SSM by shark size.
Colours indicate three size classes of tiger sharks (large = red, medium = orange, small = white). Black dashed lines indicate the 5 and 10 km buffer areas around the study sites (I-S = Isabela-South, C-B = Cerro Ballena, B-S = Bachas-Salinas) and sea turtle nesting beaches (white sea turtle icon). Local bathymetry is displayed by 100 m isobaths (blue dashed lines). Right panels show zoomed areas of the study sites of I-S (upper) and B-S (lower).

