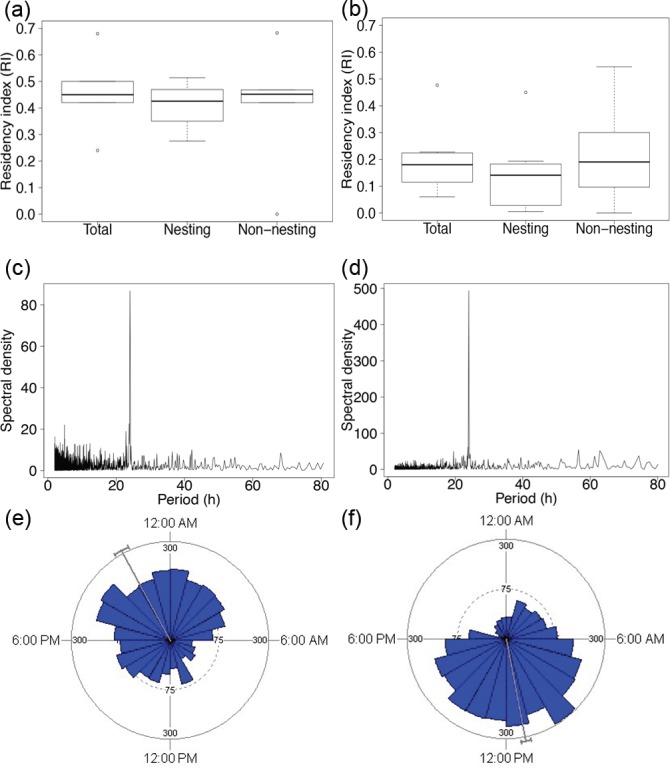
Fig 4. Patterns of residency and diel occurrence of acoustic-tagged tiger sharks.

Left panels refer to Bachas-Salinas and right panels to Cerro-Ballena. The top panel (a, b) shows residency index (RI, the total number of days a shark was detected divided by the number of days that the shark was monitored by the receivers) for the total monitored time (Total) and per season (Non-nesting and Nesting); the middle panel (c, d) shows Fast Fourier Transformations (FFT) of the number of hourly detections, with peaks indicating periods of dominant cycles; and the lower panel (e, f) shows daily detections of tiger sharks; the circle represents a period of 24 hours and the length of each wedge indicates the number of detections within each hour.
