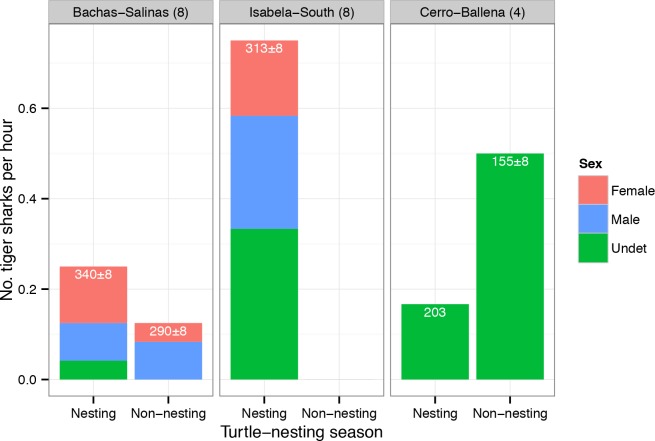
Fig 5. Relative abundance of tiger sharks at the three study sites.
Number of individual tiger sharks per hour by sex recorded by the stereo-BRUVs in the nesting or the non-nesting season for turtles. The number of camera deployments at each site is reported in parentheses. The average TL ± SE (cm) of the sharks recorded at each site is given at the top of each bar.

