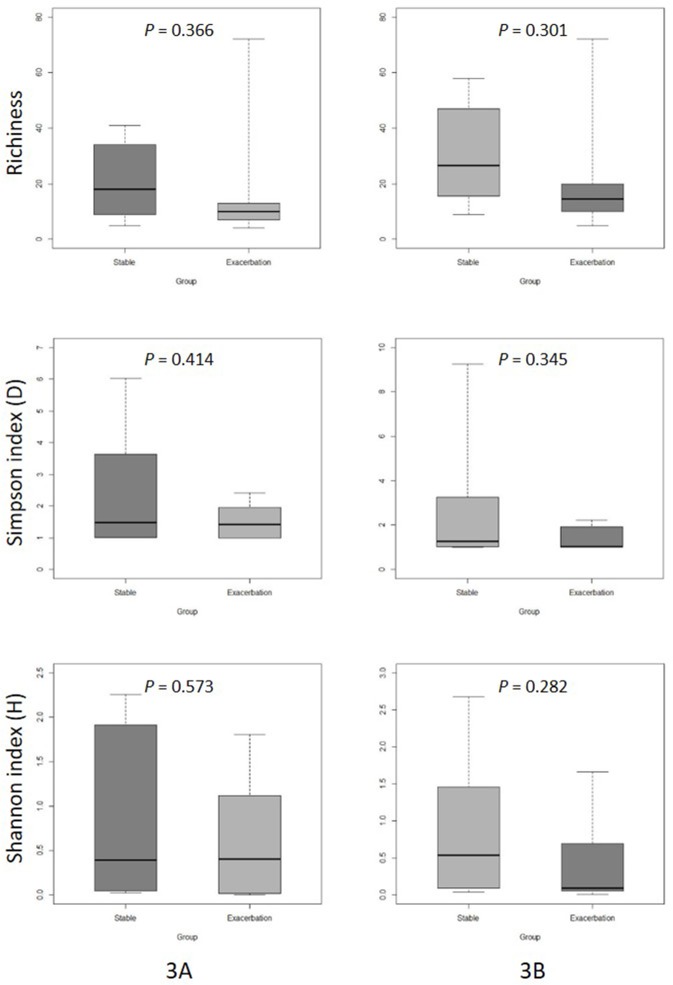
Fig 3.
Boxplot comparison of mean diversity in BAL samples between clinically stable and exacerbated bronchiectasis patients (3A: genus, 3B: family). Three measures are presented: upper (richness), middle (Simpson’s index), and lower (Shannon diversity index). The top and bottom boundaries of each box indicate the 75th and 25th quartile values, respectively. Lines within each box represent the 50th quartile values. Ends of whiskers mark the lowest and highest diversity values in each box.

