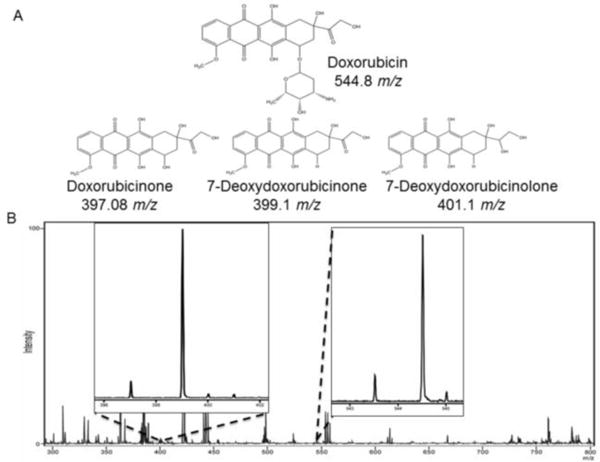
Figure 4.

(A) Doxorubicin and its metabolites found within this study. (B) Typical spectrum obtain in MALDI-IMS experiment. The peaks for doxorubicin as well as the three metabolites are distinct from not only one another but all the lipid mass range.
