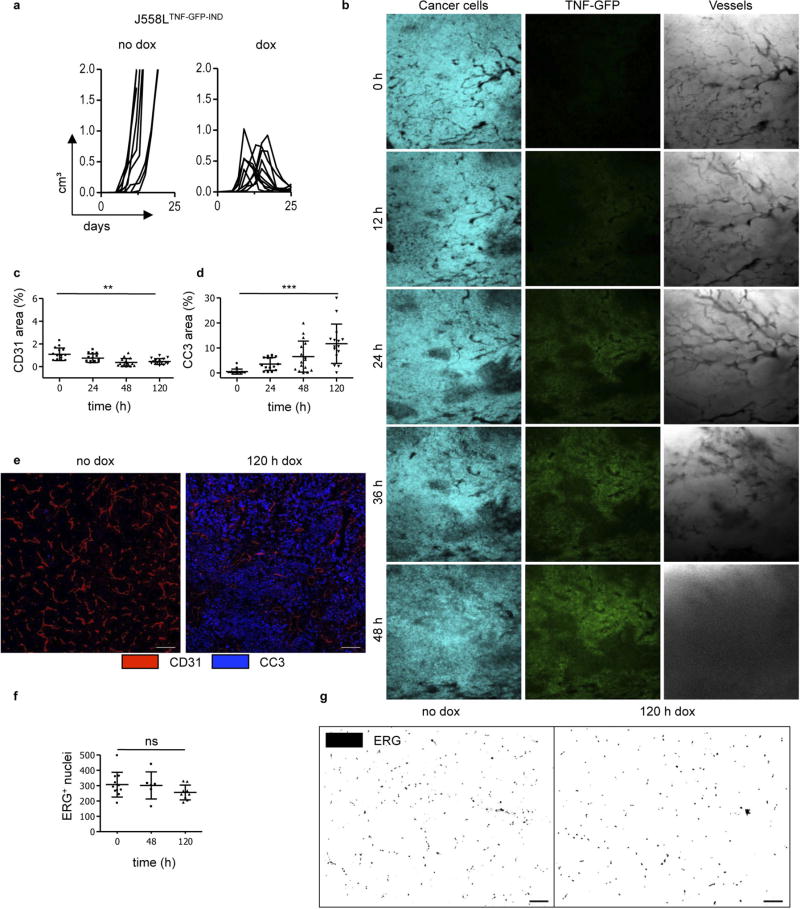
Extended Data Figure 7. Induction of TNF–GFP fusion protein induces regression of established J558LTNF-GFP-IND tumours and bursting of blood vessels.
a, 106 J558LTNF-GFP-IND cells were injected into Rag− mice that were left untreated (left panel) or treated with dox (right panel) when tumours had a size of 611 ± 201 mm3. Tumours eventually relapsed owing to selection of TNF–GFP loss variants (data not shown) (n = 9 no dox; n = 10 with dox). b, Window chamber imaging of a J558LTNF-GFP-IND tumour at lower magnification. The same procedure as described in Fig. 3c. Two-week-established J558LTNF-GFP-IND tumour was imaged for 2 days. Blue, cancer cells; green, TNF–GFP fusion protein and right vascular network. One representative out of four experiments is shown. c, d, Quantification of histological analysis for CD31 and cleaved caspase 3 (CC3) staining, respectively. Each dot represents one field of view analysed by ImageJ. e, Representative CD31 and CC3 staining before and 120 h after dox. f, Quantification of ERG+ nuclei from immunohistology. g, Representative ERG staining without and 120 h after dox. Scale bars, 100 µm. Three tumours with 4–6 fields of view were analysed. **P < 0.01 and ***P < 0.001. The number of mice, replications and sample size for each experiment are shown in Supplementary Table 3.

