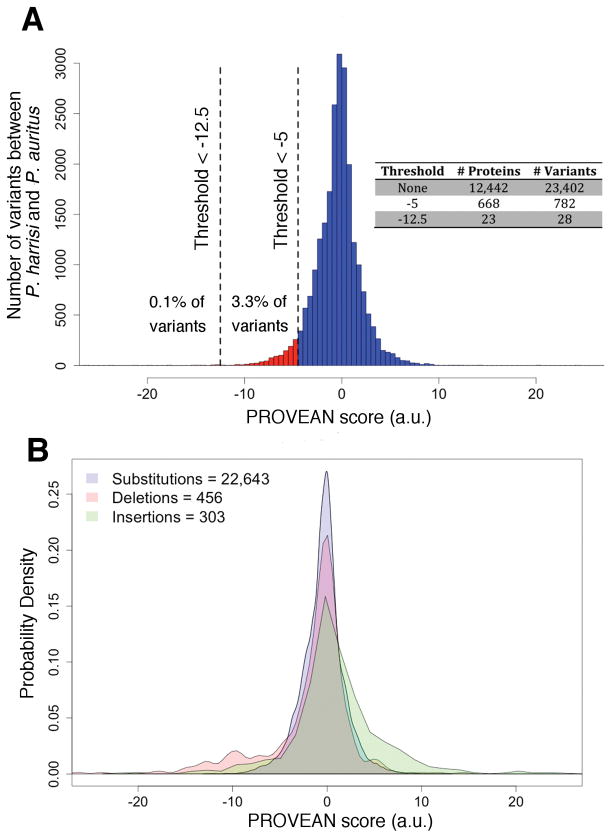
Fig. 2. Distribution of the effect of variants between P. auritus and P. harrisi.
(A) We used PROVEAN to predict the effect on protein function of 23,402 variants contained in 12,449 orthologous pairs between P. auritus and P. harrisi. 4,966 pairs contained no variants. The more negative the score; the more likely the variant affects protein function. PROVEAN score thresholds used in this study are drawn as vertical dashed lines. Number of proteins and variants found for each threshold are presented in inset table. (B) Density of PROVEAN scores for each class of variant. The same variants presented in (A) were classified as single amino acid substitutions, deletions, and insertions. Number of variants in each class is indicated in the legend.

