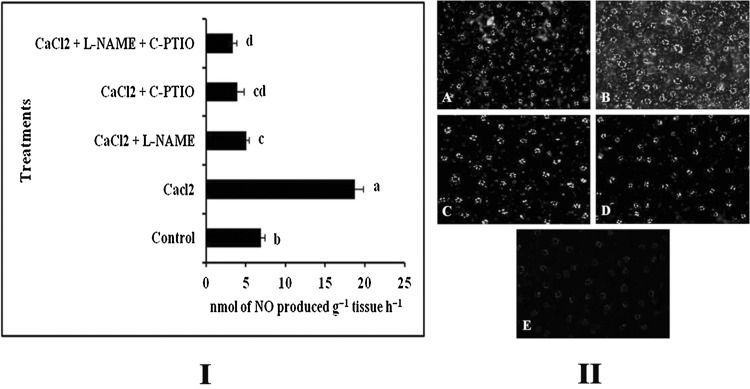
Fig. 2.
Effect of foliar application of CaCl2 (0.5%) along with different NO modulators on the production of NO. I Spectrophotometric analysis of NO production in the leaf tissue. II Real-time detection of NO. NO production in leaf epidermal cells was stained by DAF-2DA. (A) Control; (B) CaCl2 (0.5%); (C) CaCl2 (0.5%) + L-NAME (10 µM); (D) CaCl2 (0.5%) + C-PTIO (100 µM); (E) CaCl2 (0.5%) + L-NAME (10 µM) + C-PTIO (100 µM). Results are mean ± SE of three separate experiments done in triplicate. Different letters in the bar graph specify significant difference (p < 0.05) from the control set using Duncan’s multiple range test whereas same letter denotes no significant difference between the groups

