Figure 2.
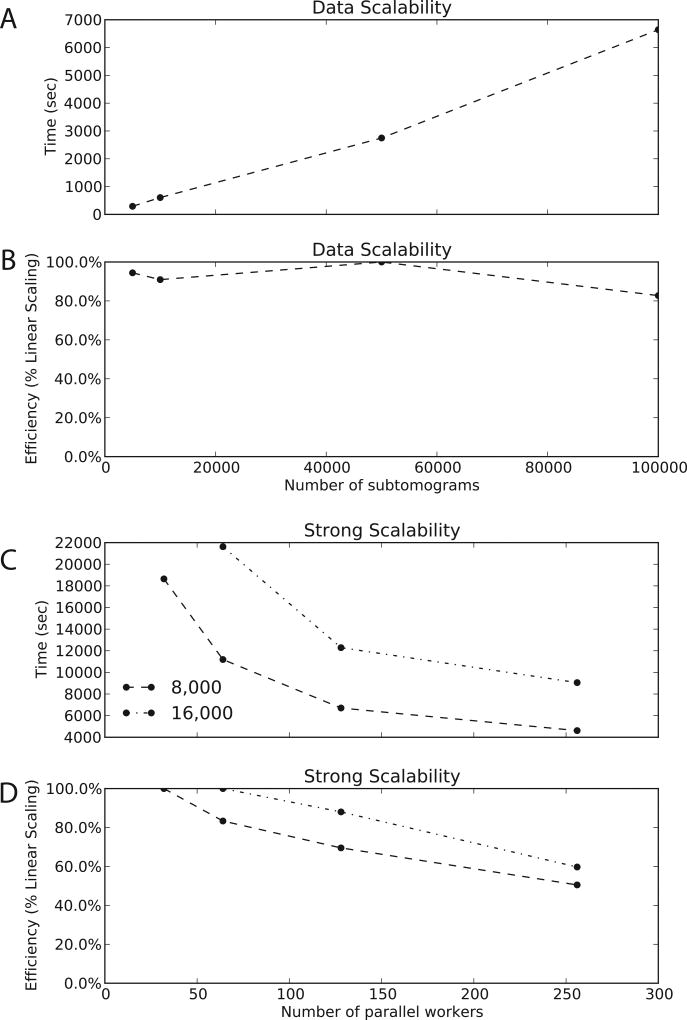
Efficiency and Scalability (A) The time required for a single round of alignment and averaging as a function of subtomogram number, for a constant 256 workers. The curve is close to linear across the entire range of data. (B) The relative efficiency of the data scalability when additional data is added, for a constant 256 workers. The rate of processing is very stable across several orders of magnitude. (C) The time required for a single round of alignment and averaging for two different data sets, with 8,000 and 16,000 subtomograms. The number of workers varies from 32 to 256. For a relatively small number of subtomograms, there are not enough subproblems generated to occupy 256 workers, so some are idle, creating the plateau seen in the graphs. (D) The relative efficiency of strong scalability. For these problem sizes TomoMiner scales well, with very little overhead for the increased communication and coordination load of additional workers. There is a clear loss of efficiency when using too many workers for a given problem size, but this demonstrates that even for medium-sized data sets (10,000+ subtomgorams) TomoMiner is far away from reaching its computational limits.

