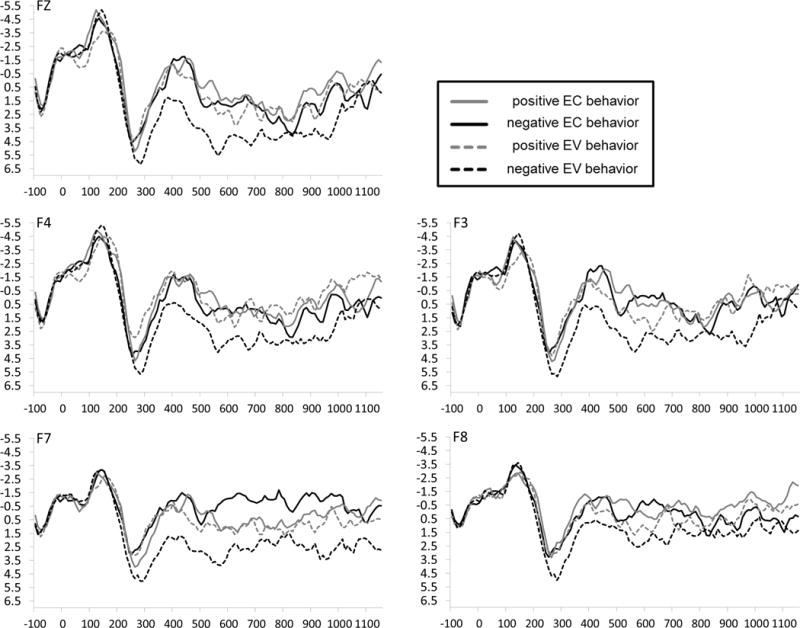
Figure 1.

ERP waveforms measured at frontal electrodes as a function of target behavior valence and consistency with previous expectancies. Zero on the x-axis (in ms) indicates the onset of the final word in each sentence, which conveyed both the valence (positive or negative) and consistency (expectancy-consistent [EC] or expectancy-violating [EV]) of the behavior. The P2 is the prominent positivity in the waveform peaking around 280 ms post-stimulus.
