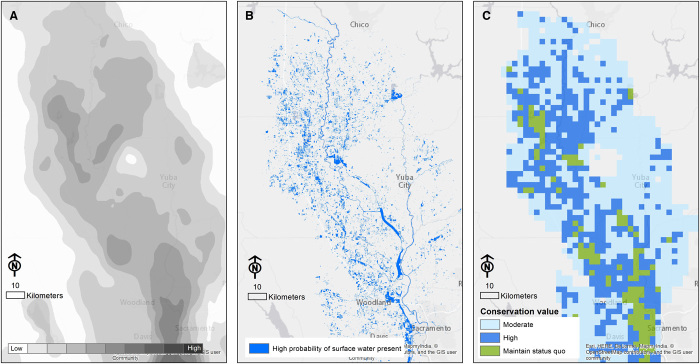
Fig. 3. Estimated shorebird abundance, surface water availability, and conservation value in the Sacramento Valley for February.
(A) Relative abundance of shorebirds. (B) Probability of surface water based on NASA Landsat imagery. (C) Ranked conservation value in terms of potential shorebird habitat. Areas of high shorebird predictions and low water availability represent highest conservation value in terms of potential shorebird habitat return on investment. Highest conservation value (dark blue), moderate conservation value (light blue), existing refuges, and maintain status quo areas (green).

