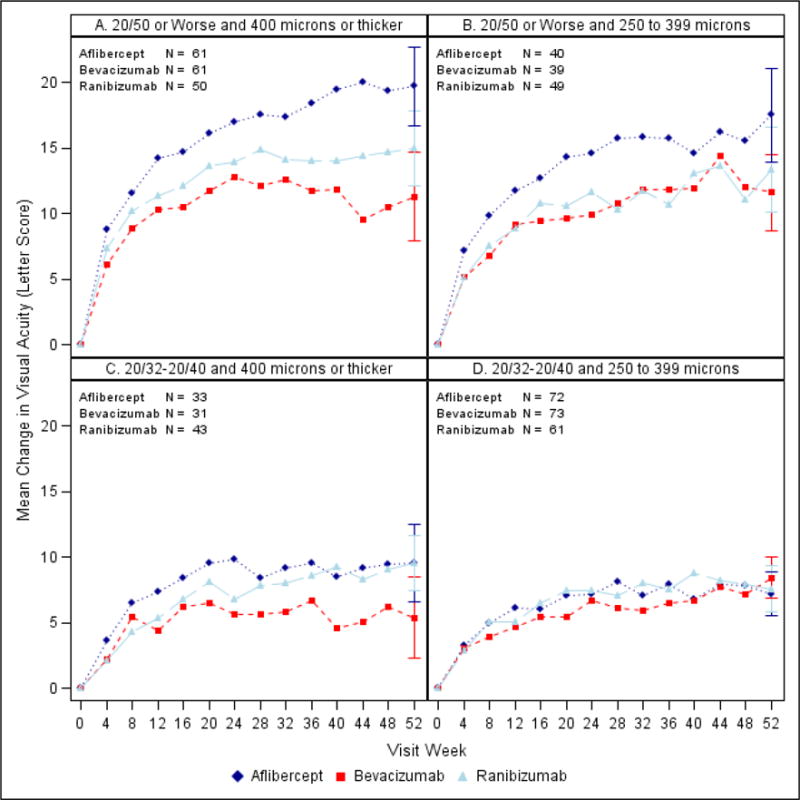
Figure 2.

Mean change in VA over time by baseline VA and CST. A. Worse and thicker. B. Worse and thinner C. Better and thicker. D. Better and thinner. CST values were translated2 to a Stratus equivalent thickness. All available data shown at each visit; Ns for 52 week visit.
