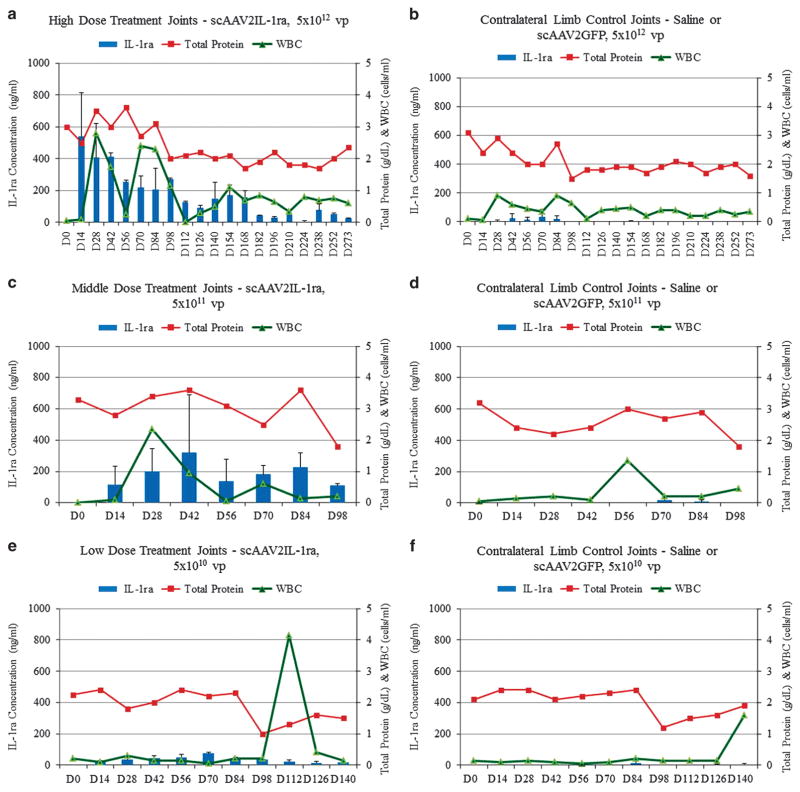
Figure 2.
(a–f) Mean IL-1ra (ng ml−1) (left axis), total protein (g dl−1) and WBC (cells per μl) (right axis) levels in high dosed, middle dosed, low dosed and contralateral control limb synovial fluid samples (n =2). S.d. is shown for IL-1ra levels only. Time frames differ (x-axis) because the middle dosed animals were euthanized at Day 98 and the low dosed animals were given a second administration of virus at Day 154 (therefore x-axis extends up until the last time point before the second injection). High dosed joints produced an average between 200 and 550 ng ml−1 up to day 98 and then between 20 and 200 ng ml−1 thereafter. Middle dosed joints produced between an average of 100 and 300 ng ml−1 up to day 98, at which time those horses were terminated, and low dosed joints produced 10–80 ng ml−1 up to day 140, at which point they were redosed (x-axis only goes to last time point before re-injection). WBC and TP were not different between joints injected with scAAV2IL-1ra or scAAV2GFP or saline.

