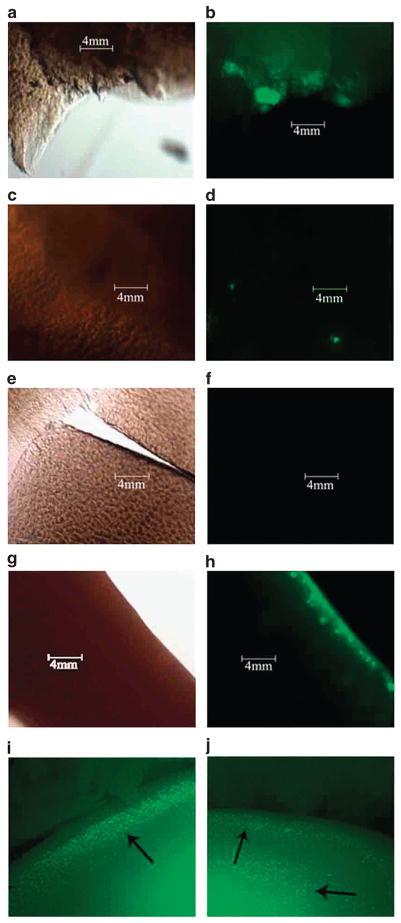
Figure 4.
(a–j) Microscopic imaging of cartilage explants 48 h after euthanasia and collection. Explants were observed under × 100 magnification with (right image) and without (left image) a fluorescent filter (excitation of 495 nm, emission of 521 nm). High dosed (scAAV2GFP) joints are shown in panels a and b, middle dosed joints are shown in c and d, and low dosed joints are shown in panels e and f. Cartilage from the joints re-injected with scAAV6GFP are shown in panels g and h. Panels i and j represent arthroscopic images 4 months following a joint injected with scAAVGFP. The bright green dots represent transduced chondrocytes within the cartilage viewed arthroscopically following injection.

