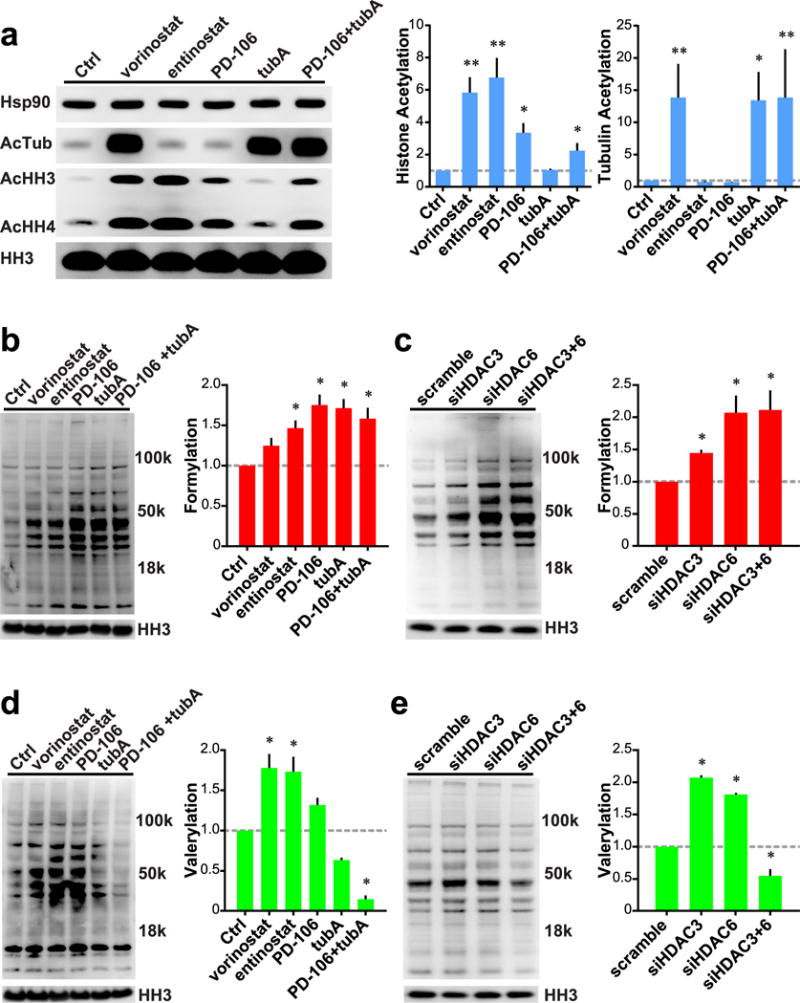
Figure 4.

Roles of HDACs 3 and 6 on global cellular formylation and valerylation. (a) Left: Western blot analysis of Hek293 cells treated with small molecule HDAC inhibitors. Right: Quantification of histone and tubulin acetylation normalized to HH3 levels. (b) Left: Global formylation levels of Hek293 cells treated with HDAC inhibitors. Right: Quantification of global formylation normalized to HH3 levels. (c) Left: Global formylation levels of Hek293 cells treated with siRNA. Right: Quantification of global formylation normalized to HH3 levels. (d) Left: Global valerylation levels of Hek293 cells treated with HDAC inhibitors. Right: Quantification of global valerylation normalized to HH3 levels. (e) Left: Global valerylation levels of Hek293 cells treated with siRNA. Right: Quantification of global valerylation normalized to HH3 levels. All inhibitors used at 1 μM, except tubA at 0.5 μM. Data recorded after 24 h of treatment; representative Western blots of n ≥ 3 experiments. Error bars are SEM. *p-value < 0.01. **p-value < 0.0001. All statistical analyses were Dunnett’s multiple comparisons of means to the means of their respective controls.
