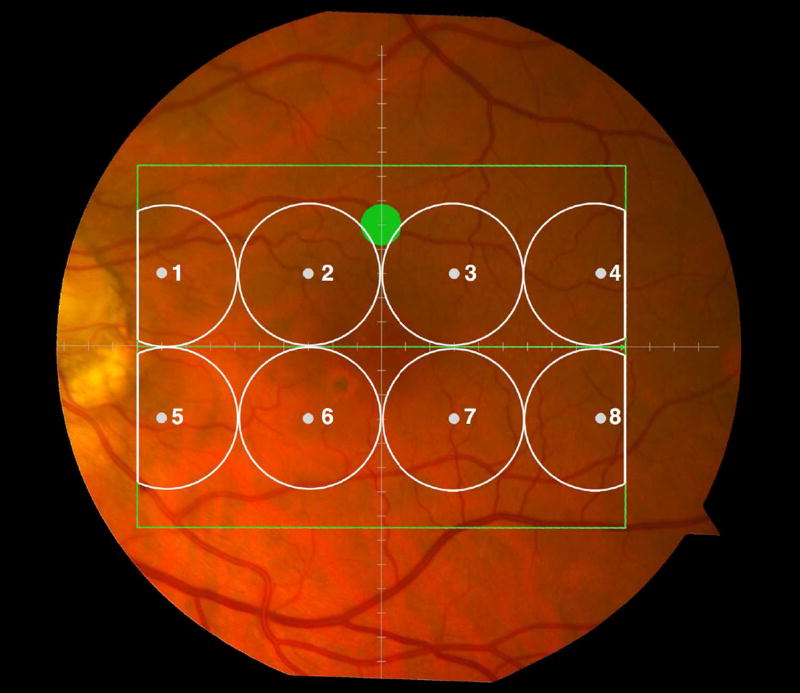
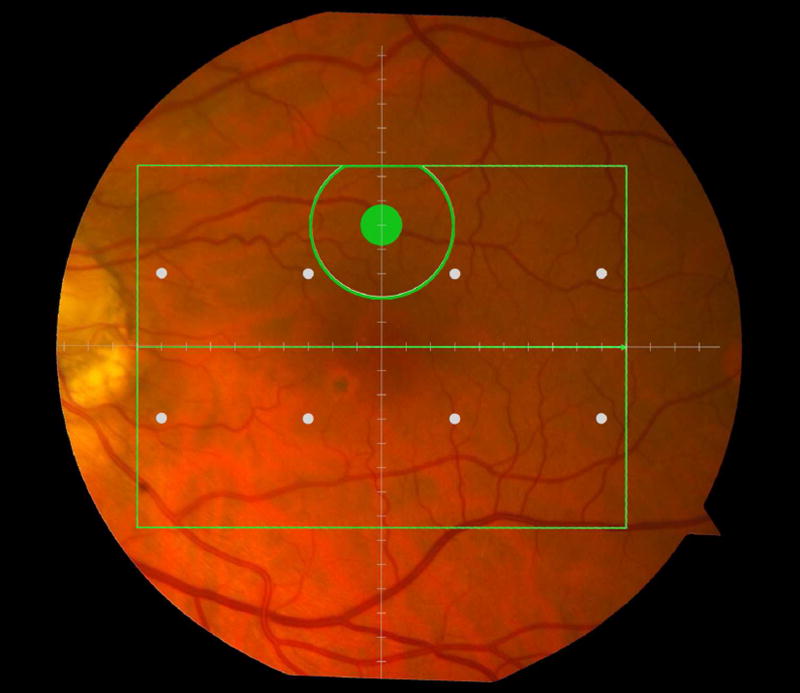
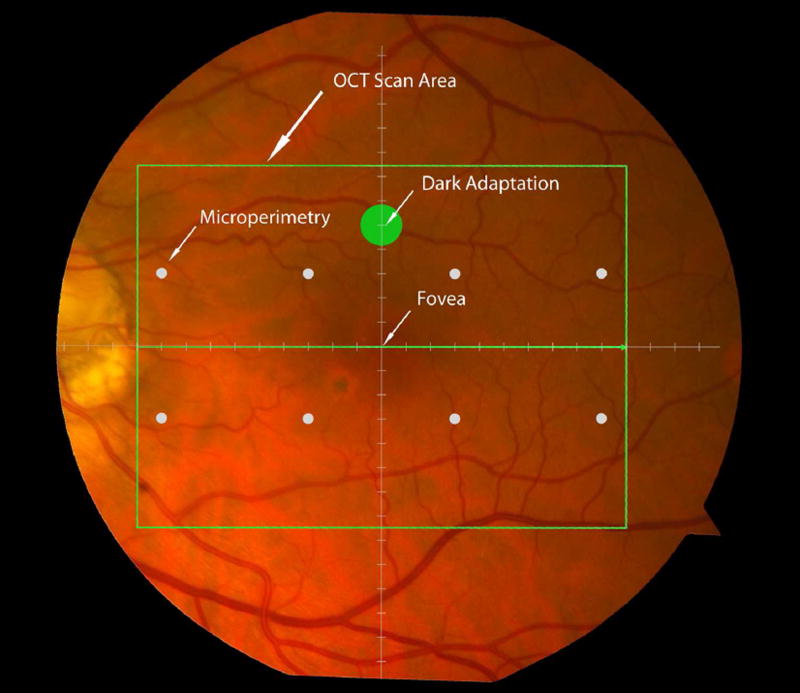
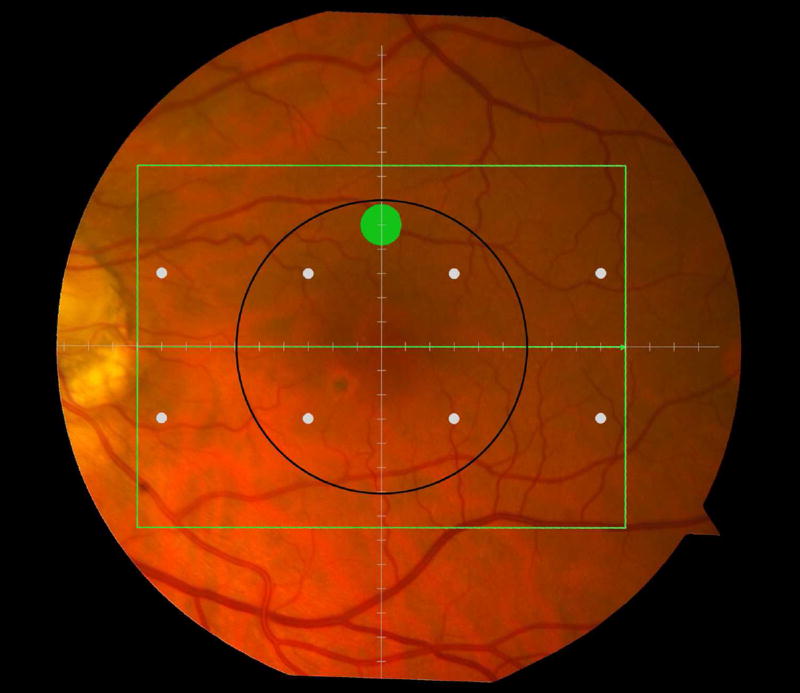
Figure 1.
Macular locations used for structure-function analysis. The green rectangle delineates the area of spectral domain optical coherence tomography Spectralis imaging on a color photograph of the fundus (Top left). The large green spot represents the location and size of the test target where rod-mediated dark adaptation was evaluated. The small white spots represent the locations and sizes of 8 test targets where cone-mediated light sensitivity was measured. Total retinal pigment epithelium (RPE)-drusen-complex volume, abnormal volumes, and retinal volumes (outer, inner, and total) were calculated centered at the fovea within a 12° diameter signified by the black circle (Top right), within a 6° diameter at each of eight perimetry points outlined in white circles (Bottom left), and within a 6° diameter at the dark adaptation point outlined by the green circle (Bottom right). A consistent truncation of the volumes was applied at the margin of the area of OCT imaging for all eyes.


