
Figure 5. The combination of lurbinectedin and irinotecan suppressed Ewing sarcoma xenograft growth and EWS-FLI1 activity in vivo.
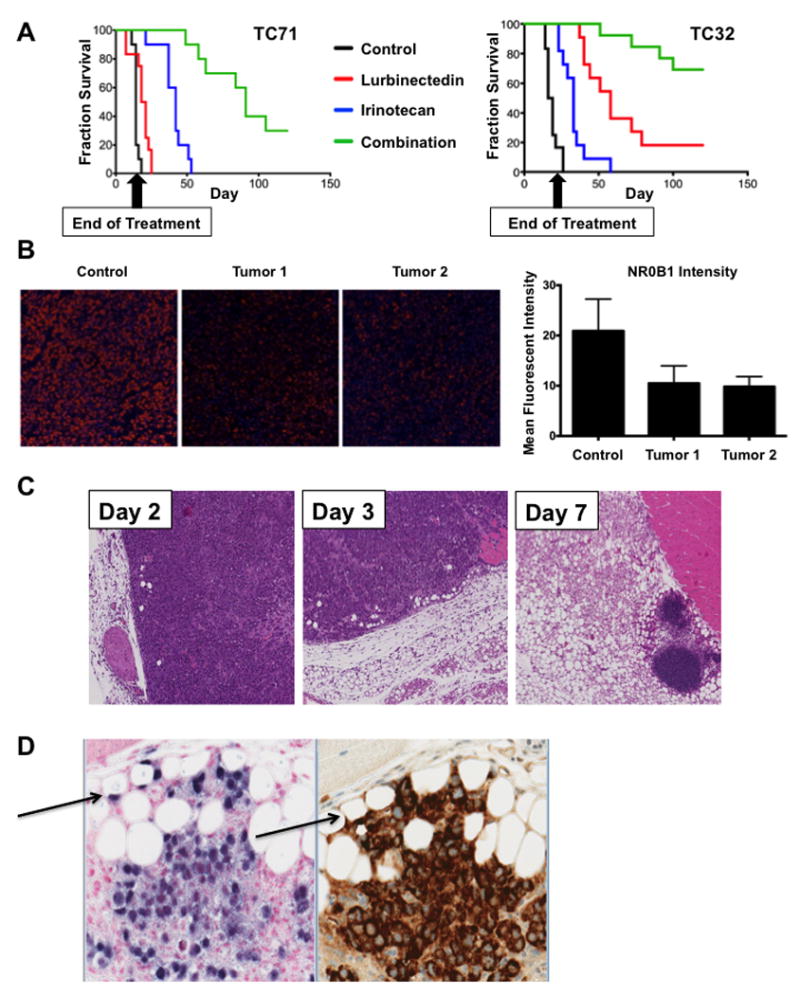
A) Survival curves for mice bearing TC71 (left) or TC32 (right) xenografts. Both cohorts were treated with lurbinectedin on days 0 and 7. TC32 mice were treated with irinotecan on days 3 and 10, while TC71 mice received an additional dose of lurbinectedin on day 14 and irinotecan on days 1-3, 8-10, and 15 -17. All groups survived significantly longer than control (all P < 0.0001). P-value was determined using a Cox proportional hazards regression. B) Left, Immunofluorescence images from xenograft tissue showing NR0B1 staining (red) in the control and lurbinectedin cohorts at day 3. Right, quantification of the immunofluorescence imaging on the left. Images were obtained at 20X magnification. C) H & E staining showing gradual differentiation of TC71 tumor into fat in mice; samples collected on days 2, 3, and 7 of treatment with both irinotecan and lurbinectedin. D) Section of xenograft containing adipocytes of human origin (arrows). Stains are left, ALUish DNA probes for human specific ALU repeat elements at 20X, and right, human-specific mitochondrial surface stain.