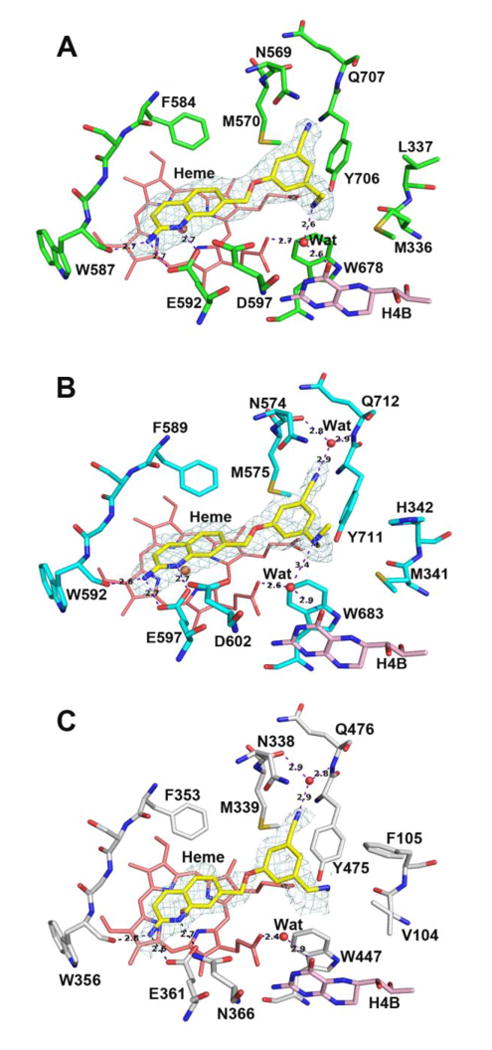
Figure 3.

Active site structures of 8 bound to rat nNOS (A), human nNOS (B), and human eNOS (C). In this and all the following figures for crystal structures the omit Fo – Fc density map for the inhibitor is shown at the 2.5 σ contour level. Major hydrogen bonds are shown as dashed lines with distances in Å. Figures were prepared with PyMol (www.pymol.org).
