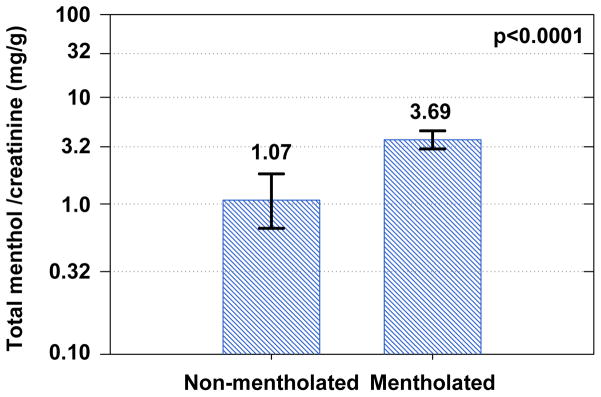
Figure 2.
Comparison of creatinine adjusted total menthol concentration among non-mentholated cigarette smokers (N=27) and mentholated cigarette smokers (N= 68). Geometric mean and 95% confidence intervals are plotted in log scale. The threshold p-value corresponds to a Wilcoxon / Kruskal-Wallis test comparing the population means.

