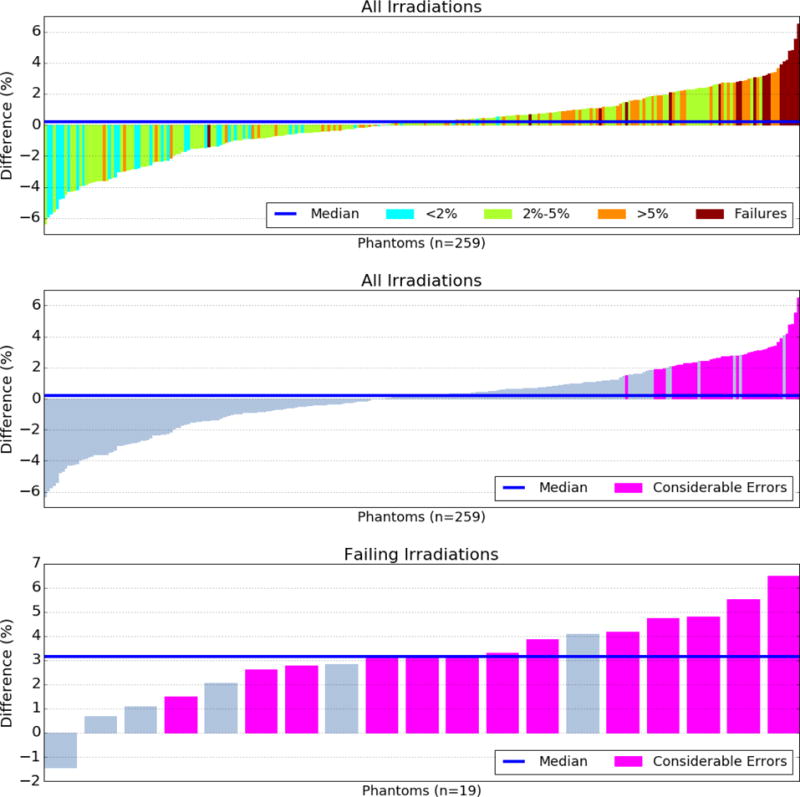
Figure 1.

Difference values in accuracy between the institution’s treatment planning system (TPS) calculation and IROC-Houston’s reference recalculation. Positive values indicate the recalculation was more accurate. The top and middle panels show the same data with different color overlays. The top overlay indicates the institution’s original agreement with the phantom’s thermoluminescent dosimeters. Cyan indicates the institution calculated the delivered dose very accurately, whereas dark red indicates the institution calculated the delivered dose very poorly. Pink values in the middle and bottom panels indicate a considerable TPS calculation error for that irradiation.
