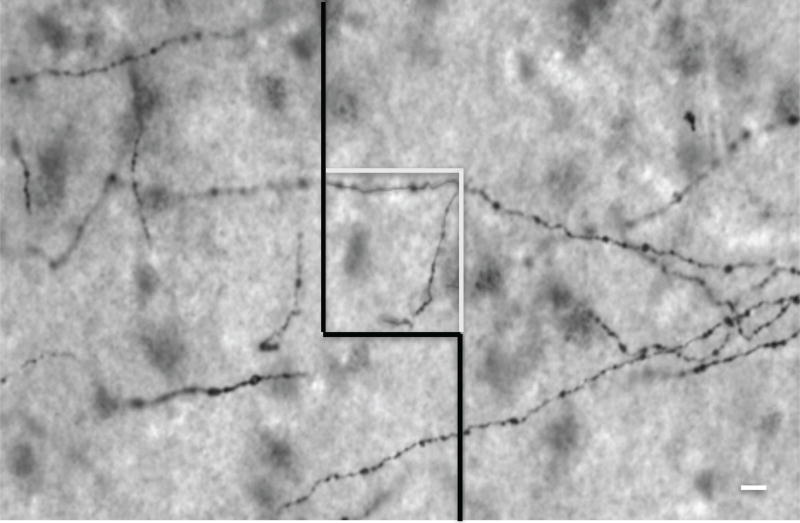
Figure 1.
Photomicrograph of axons expressing the serotonin transporter (SERT) in layer VI of the orbitofrontal cortex as visible using the 40× objective of the microscope. The square located in the center of the image represents a 3-dimensional counting box. The 3-dimensional length density of all SERT-immunoreactive axons was determined within randomly initiated and systematically placed counting boxes. Scale bar = 10 µm.

