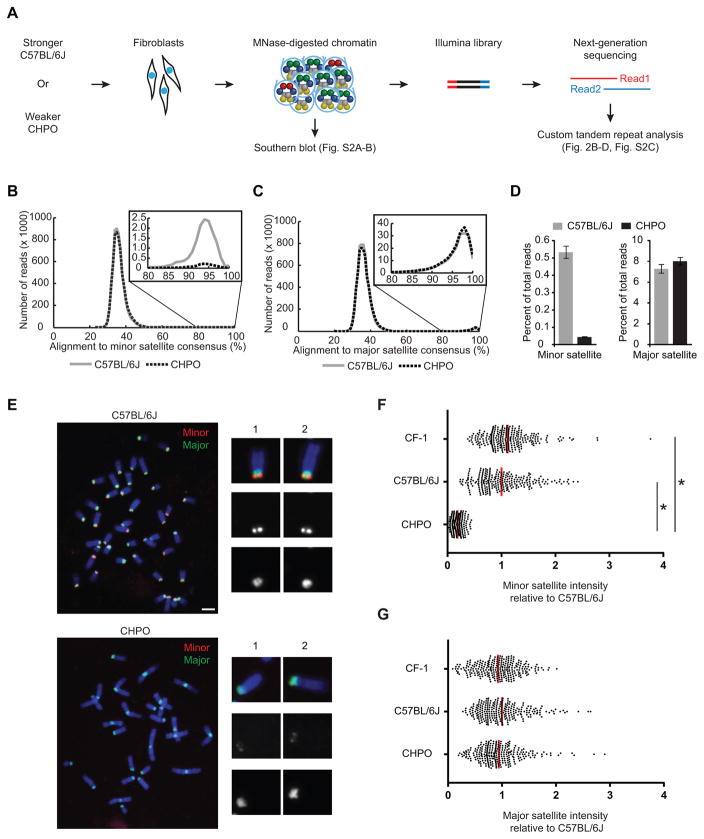
Figure 2. Stronger centromeres contain more minor satellite than weaker centromeres.
(A–D) MNase-seq of C57BL/6J (stronger) and CHPO (weaker), as shown in the schematic (A). Reads were aligned to a trimer of minor satellite or a dimer of major satellite consensus sequences (see Figure S1E). Histograms show distribution of reads aligning to minor (B) or major (C) satellite, with 80–100% range expanded in insets. The percent of reads that aligned with ≥ 80% identity was calculated (D, mean±SEM, n=3 independent experiments). See also Figure S2 and Table S2.
(E–G) FISH analysis of minor (red) and major (green) satellite on metaphase chromosomes of C57BL/6J and CHPO (see also Figure S3). Representative images are shown (E), with single chromosomes magnified in insets. Minor (F) and major (G) satellite signals were quantified for CF-1, C57BL/6J and CHPO. Each dot represents one centromere; red bar, mean; n≥260 in each case; * p < 0.0001; scale bars 5 μm.

