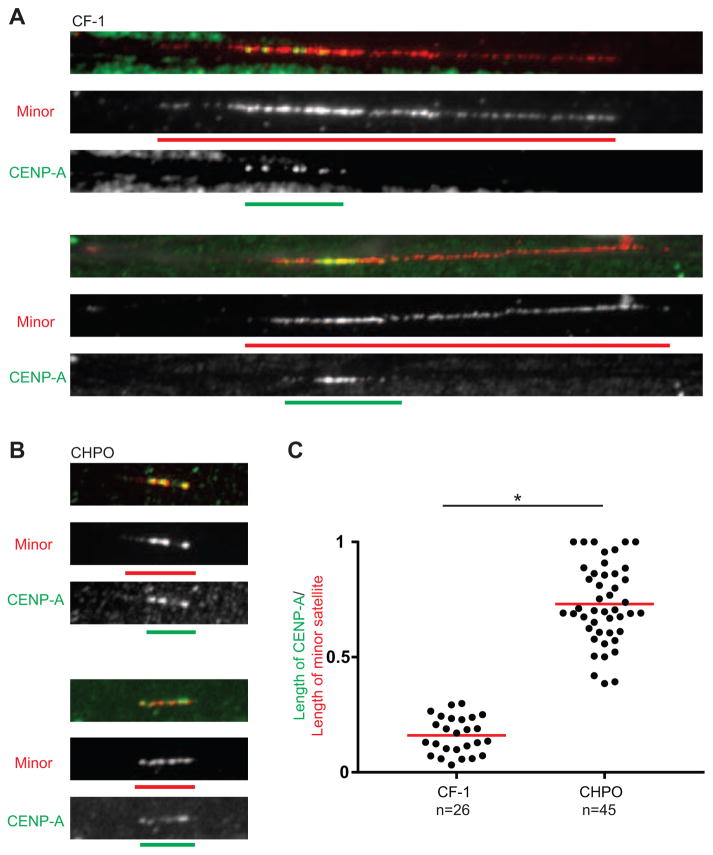
Figure 3. CENP-A nucleosomes fill the minor satellite region at weaker centromeres.
(A and B) Representative images of CENP-A (green) and minor satellite (red) localized by immunofluorescence and FISH, respectively, on extended chromatin fibers from stronger (A, CF-1) or weaker (B, CHPO) centromere strains. Green and red bars show the length of CENP-A and minor satellite signals, respectively. Scale bar, 5 μm.
(C) Ratio of the length of CENP-A to the length of minor satellite. Each dot represents one centromere; red bar, mean; * p < 0.0001.

