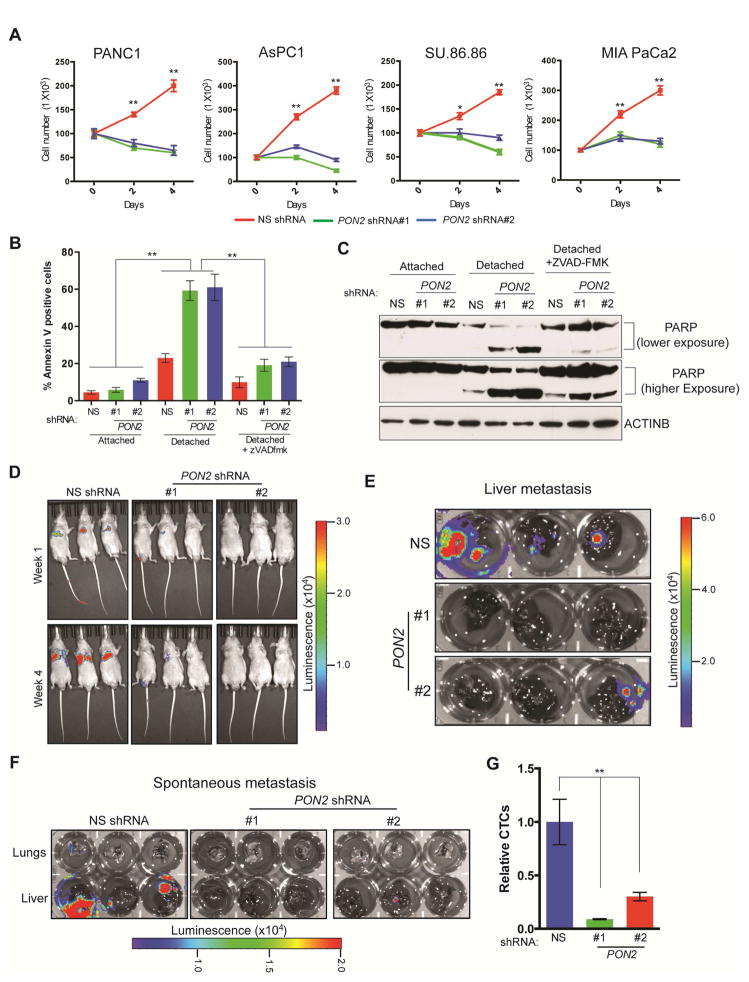
Figure 2. Loss of PON2 results in anoikis induction and metastasis inhibition.
A. PDAC cell lines expressing PON2 or nonspecific (NS) shRNAs were seeded on poly(HEMA)-coated plates. Viable cells were counted after staining with trypan blue, and the relative numbers of viable cells are plotted at the indicated times. B. PANC1 cell lines expressing the indicated shRNAs were analyzed for apoptosis under attached and detached conditions by flow cytometry after staining with annexin V-FITC and propidium iodide. Percentage of annexin V-FITC-positive cells (attached and detached) after treatment with Z-VAD-FMK (10 μM) is shown. C. PANC1 cells expressing PON2 or NS shRNAs were grown under attached or detached conditions. Detached cells were either left untreated or treated with Z-VAD-FMK (10 μM). Cell lysates were analyzed for PARP cleavage by immunoblot analysis. ACTINB was used as a loading control. D. Athymic nude mice (n=3) were injected with PANC1 cells expressing PON2 or NS shRNAs via the tail vein. Lung metastasis was monitored by bioluminescence imaging. Representative images are shown at week 1 and week 4. E. Athymic nude mice (n=3) received intrasplenic injections of luciferase-tagged PANC1 cells expressing either PON2 or NS shRNA to cause liver metastasis. Metastatic tumor growth in the livers was visualized after 6 weeks. Bioluminescence images of livers isolated from the mice are shown. F. Luciferase-tagged PANC1 cells carrying PON2 or NS shRNA were injected into the pancreases of athymic nude mice (n=3). Spontaneous metastasis to the livers and lungs was visualized after 6 weeks. Bioluminescence images of livers and lungs isolated from the mice are shown. G. qPCR analysis of circulating tumor cells originating from primary tumors formed by injecting PANC1 cells carrying PON2 or NS shRNA into the pancreas of athymic nude mice (n=3). Data are mean ± SEM. *p<0.05, **p<0.005. See also Figure S3, Table S2 and Table S3.

