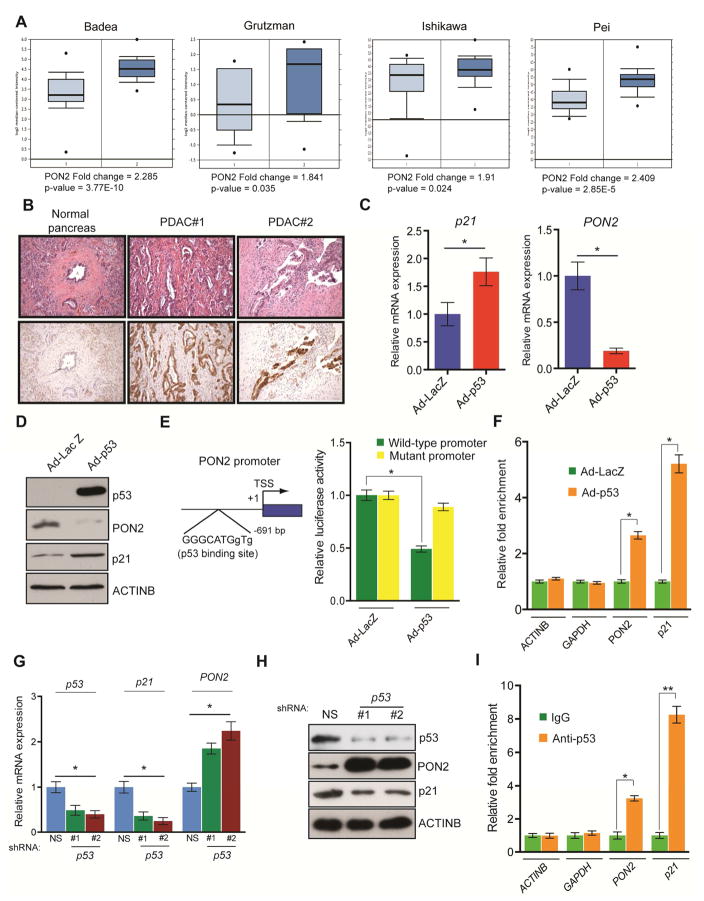
Figure 3. Tumor suppressor p53 transcriptionally represses PON2.
A. Analyses of PON2 mRNA levels of normal pancreatic tissues and PDAC tumor samples from four indicated studies in the Oncomine database. B. Immunohistochemistry analyses of PON2 levels in normal pancreatic tissue and PDAC tumor samples. Corresponding H&E staining is shown in the top panel. C. Transcript levels of p21 and PON2 in AsPC-1 cells infected with adenovirus expressing p53 (Ad-p53) or control adenovirus expressing the β-galactosidase gene (Ad-LacZ) were evaluated by qRT-PCR. D. AsPC-1 cells infected with Ad-p53 or Ad-LacZ were analyzed for the indicated proteins by immunoblotting. E. (left) Schematics showing the p53 binding site on the PON2 promoter. (right) PON2 promoter-firefly luciferase reporters, with intact or mutated p53 binding sites, were transfected into AsPC-1 cells along with adenovirus expressing LacZ or p53-GFP. Luciferase activity was measured after 48 h and is presented as relative luciferase units. F. AsPC-1 cells expressing Ad-p53 or Ad-LacZ were analyzed using the ChIP assay to evaluate the binding of p53 to the PON2 promoter. G. Transcript levels of p53, p21, and PON2 in HPNE cells carrying p53 or nonspecific (NS) shRNA were evaluated by qRT-PCR. H. Immunoblot analyses of the indicated proteins in HPNE cells carrying p53 or NS shRNAs. I. ChIP assay to measure p53 binding on the PON2 promoter using IgG or anti-p53 antibody. The ACTINB, GAPDH, and p21 promoters were used as controls. Data are mean ± SEM. *p<0.05, **p<0.005.

