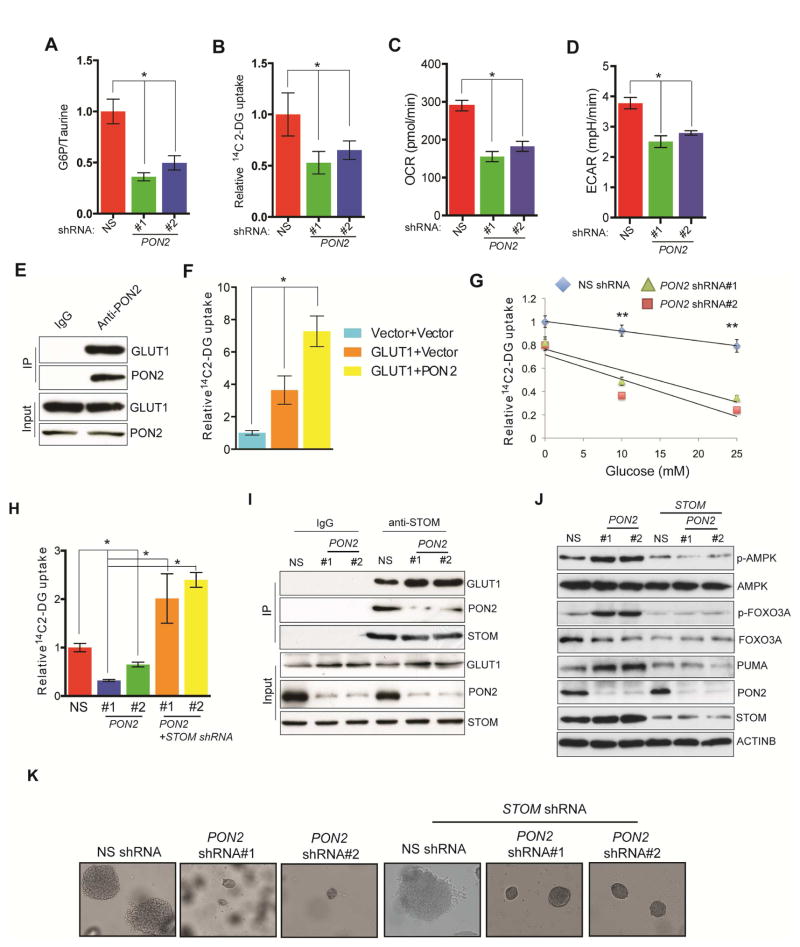
Figure 5. PON2 regulates the cellular starvation response by regulating GLUT1 activity via STOM.
A. Glucose 6-phosphate/taurine ratio in PANC1 cells expressing PON2 or nonspecific (NS) shRNAs. B. Relative [14C]-2-DG uptake in PANC1 cells expressing PON2 or NS shRNAs. C. Oxygen consumption rate expressed as pmol/min in PANC1 cells expressing PON2 or NS shRNAs. D. Extracellular acidification rate (ECAR) expressed as mpH/min in PANC1 cells expressing PON2 or NS shRNAs. E. Co-immunoprecipitation assay in PANC1 cells using IgG or anti-PON2 antibody. Immunoprecipitates and lysates were analyzed for the indicated proteins. F. Relative [14C]-2-DG uptake in PANC1 cells co-expressing GLUT1 along with vector or PON2. G. Relative [14C]-2-DG uptake in a glucose competition assay in PANC1 cells expressing PON2 or NS shRNAs. H. Relative [14C]-2-DG uptake in PANC1 expressing STOM or PON2 and STOM or NS shRNAs. I. Co-immunoprecipitation assay in PANC1 cells expressing NS or PON2 shRNAs using IgG or anti-STOM antibody. Immunoprecipitates and lysates were analyzed for the indicated proteins. J. Immunoblot analysis to measure indicated proteins in PANC1 cells expressing PON2, PON2 and STOM, or NS shRNAs. K. Soft-agar colony formation by PANC1 cell lines expressing PON2, PON2 and STOM, or NS shRNAs. Data are presented as mean ± SEM. *p<0.05, **p<0.005. See also Figure S5, Figure S6 and Table S2.

