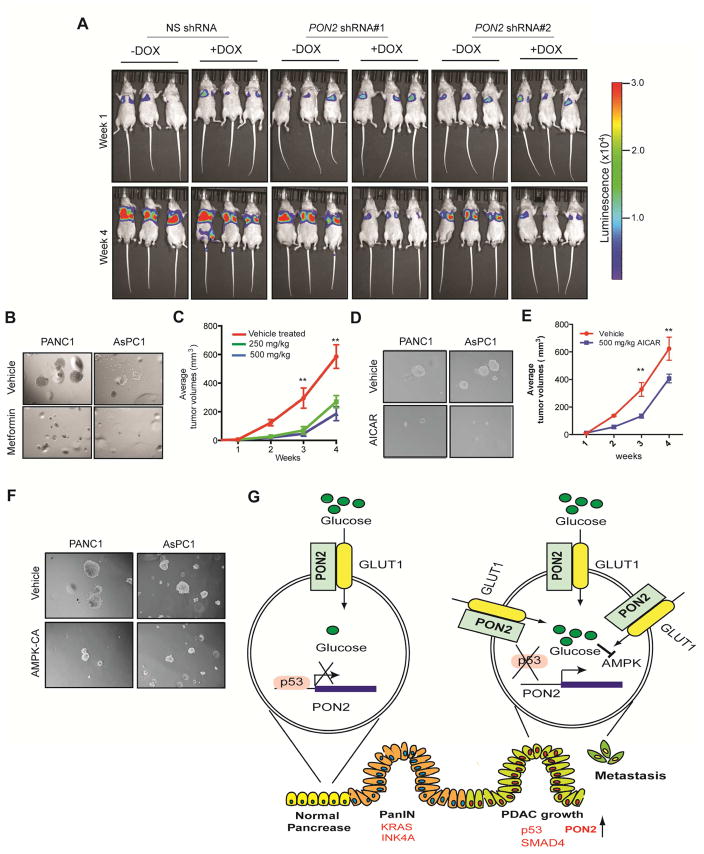
Figure 7. The PON2→AMPK→FOXO3A→PUMA Pathway is pharmacologically tractable for PDAC Treatment.
A. PANC1 cells expressing doxycycline-inducible PON2 or nonspecific (NS) shRNAs were injected into athymic nude mice (n=3) via the tail vein, and lung metastases were allowed to form. After 1 week, one group of mice was given water-containing doxycycline (20 μg/ml), and the other group was given regular water (without doxycycline). Representative images at week 1 and week 4 are shown. B. Soft-agar colony formation of PANC1 or AsPC-1 cells was evaluated after treatment with 500 μM metformin or PBS (control). Representative wells are shown. C. PANC1 cells (1×10⁶) were injected subcutaneously into the flank of athymic nude mice (n=5). The mice were then treated with either vehicle or the indicated doses of metformin by oral gavage once a day for 2 weeks. Tumor volumes were measured at the indicated time points. D. Soft-agar colony formation of PANC1 or AsPC1 cells was evaluated after treatment with 5 mM AICAR or PBS (control). Representative wells are shown. E. PANC1 cells (1×10⁶) were injected subcutaneously into the flanks of athymic nude mice (n=5). The mice were then treated with either vehicle or the indicated dose of AICAR by intraperitoneal injections once a day for 3 weeks. Tumor volumes were measured at the indicated time points. F. PDAC cells expressing constitutively active AMPK (AMPK-CA) were analyzed for anchorage-independent growth by a soft-agar assay. Representative images under the indicated conditions are shown. G. Model showing the mechanism by which PON2 promotes PDAC tumor growth and metastasis. Data are presented as mean ± SEM. **p<0.005. See also Figure S7, Table S2 and Table S3.

