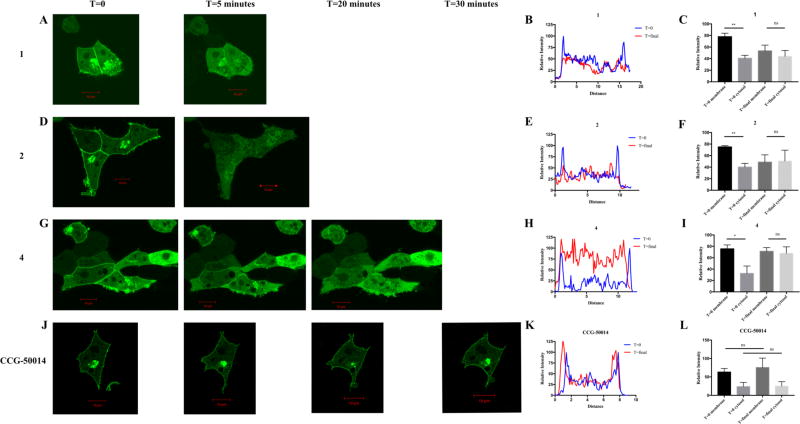
Figure 4.
Lead compounds disrupt RGS17–Gα interaction in cells. HEK293T cells cotransfected with GFPRGS17ΔN and hGαo were treated with 100 µM 1 (A), 2 (D) and 4 (G) or 100 µM RGS4 inhibitor CCG-50014 (J), and fluorescent protein cellular localization was monitored by inspection. T = 0 and T = final images were quantified with cross-sectional fluorescence intensity analysis (B, E, H, K). Representative intensity analysis is shown. Quantification of intensity analysis from all trials is shown at right (C, F, I, L). Compounds 1, 2, and 4 were performed with n = 3; CCG-50014 was performed with n = 2. Representative images are shown. Scale bars represent 10 µm. * = p ≤ 0.05; ** = p ≤ 0.01.

