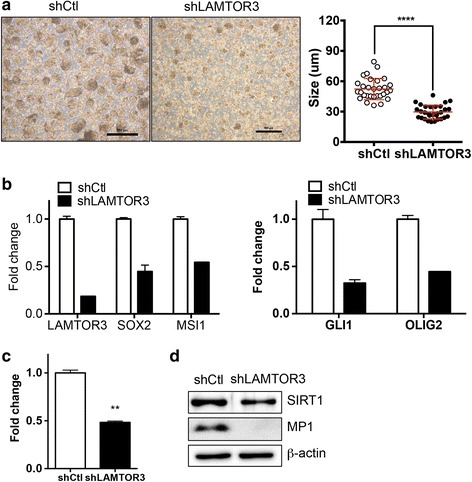
Fig. 6.

Role of LAMTOR3 in F3.EGFRviii spheres. a Sphere formation with or without LAMTOR3 expression was compared after 14 days (left panel). The graph shows the mean diameter of control and shLAMTOR3 spheres (n = 30, right panel). b and c The expression of the indicated genes was determined by real-time PCR (n = 2). d The levels of SIRT1 and MP1 were determined by immunoblotting using β-actin as a loading control
