Fig. 7.

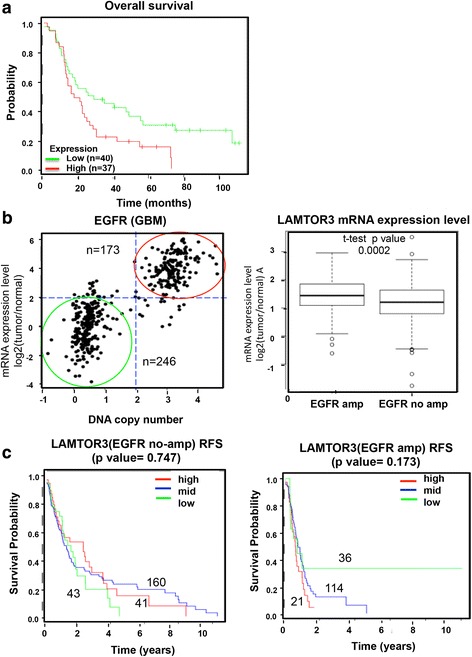
Prognostic significance of LAMTOR3 expression in brain tumors. a A Kaplan-Meier survival analysis was performed according to LAMTOR3 expression. b and c Data from the TCGA database were analyzed. b GBM samples (n = 419) were separated into two groups based on DNA copy number and mRNA expression of EGFR (left panel). The samples indicated by the red line were considered to have EGFR amplification (n = 173), while the samples indicated by the green line were considered to have no EGFR amplification (n = 246) (left panel). The expression of LAMTOR3 in the two groups is shown in the right panel (p < 0.0002). c Kaplan-Meier relapse-free survival analyses according to LAMTOR3 in the patients without (left panel) or with (right panel) EGFR amplification GBM samples (right panel)
