
Fig. 4.
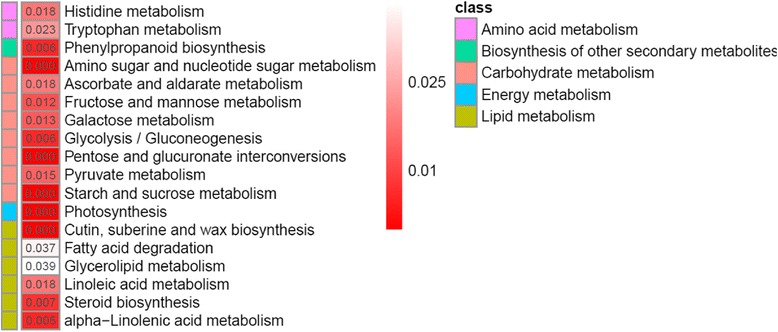
Heatmap representation of significant functional groups of differentially expressed genes between male/supermale and female flower buds. Colors show the p-value, with dark red representing low p-value and light red representing high p-value
Official websites use .gov
A
.gov website belongs to an official
government organization in the United States.
Secure .gov websites use HTTPS
A lock (
) or https:// means you've safely
connected to the .gov website. Share sensitive
information only on official, secure websites.
Heatmap representation of significant functional groups of differentially expressed genes between male/supermale and female flower buds. Colors show the p-value, with dark red representing low p-value and light red representing high p-value