
Fig. 5.
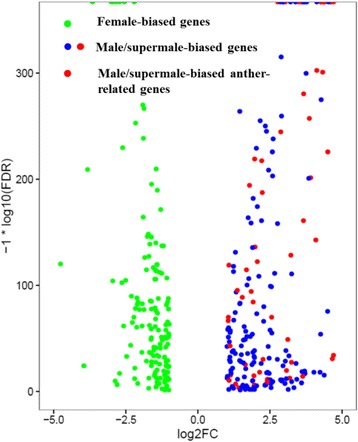
Volcano plot for differentially expressed genes involved in flower development between male/supermale and female flower buds. X axis represents the log2 (fold change value), while Y axis represents −1*log10 (FDR). Green dots show the female-biased flower-related genes, while blue and red dots represent the male/supermale-biased genes involved in flower development, among which, red dots represent anther-related male/supermale-biased genes