Fig. 2.

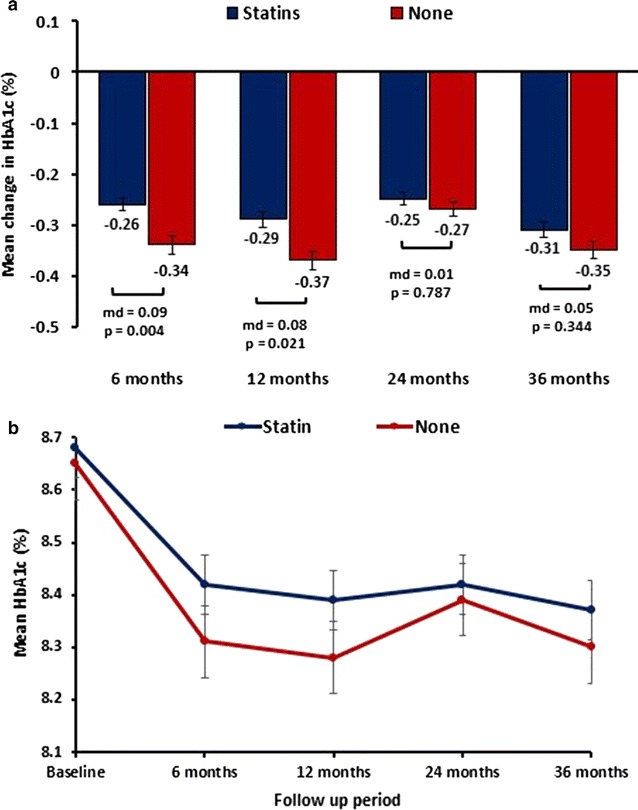
Mean differences in changes in HbA1c levels between the treatment groups (a) and the mean HbA1c levels in both treatment groups (b) (p < 0.05 from baseline for the study duration)

Mean differences in changes in HbA1c levels between the treatment groups (a) and the mean HbA1c levels in both treatment groups (b) (p < 0.05 from baseline for the study duration)