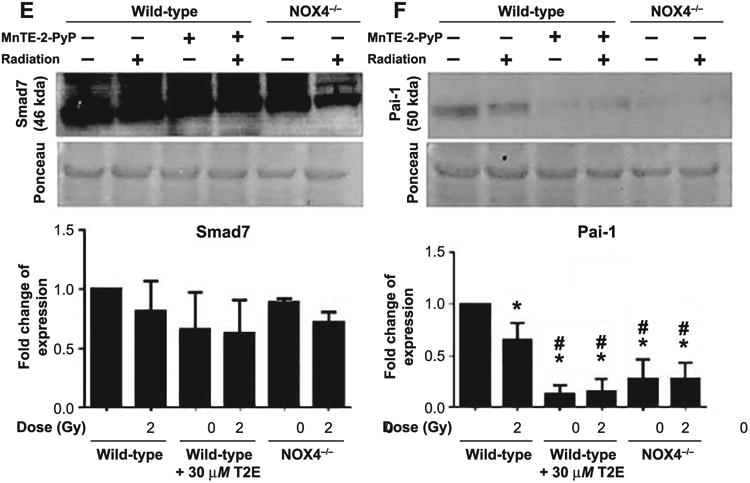
Fig. 8.


TGF-β1 signaling protein expression. Total protein (40 μg) was used for Western blotting. Equal loading of protein was confirmed by Ponceau staining of the blot. All blots were quantified in ImageJ. Fold change over wild-type nonirradiated data was plotted. Figure represents the scanned blot, corresponding Ponceau picture and the quantified data for Tgfβr2 (panel A), total Smad3 (panel B), phospho-Smad2 and total Smad2 (panel C), Smad4 (panel D), Smad7 (panel E) and Pai-1 (panel F). Significance in protein expression levels were calculated using one-way ANOVA followed by post hoc Holm-Sidak correction for multiple comparisons. *Significant difference compared to wild-type nonirradiated fibroblasts; #significant difference compared to wild-type 2 Gy irradiated fibroblasts; $significant difference compared to T2E-treated nonirradiated fibroblasts; %significant difference compared to T2E-treated 2 Gy irradiated fibroblasts; and @significant difference compared to NOX4−/− nonirradiated fibroblasts.
