Figure 4.
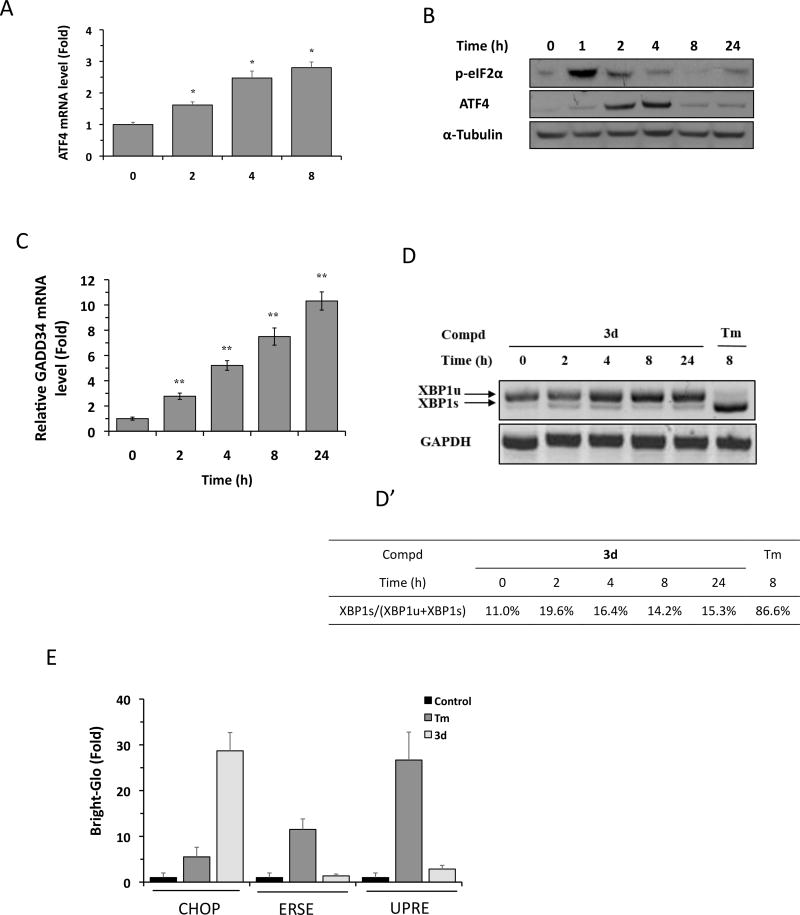
Compound 3d selectively activates eIF2α-ATF4 pathway. (A) HCC-1806 cells were treated with 3d (10 µM) for the indicated times, and ATF4 mRNA levels were analyzed by qRT-PCR. Results are the means of 4 replicate wells and are representative of 3 independent experiments. *P < 0.05 by Student’s t-test compared with DMSO-treated cells. (B) HCC-1806 cells were treated with 3d (10 µM) for the indicated times, and ATF4 and p-eIF2α protein levels were analyzed by Western blotting. α-Tubulin was used as a loading control. The data shown are representative of 3 independent experiments. (C) HCC-1806 cells were treated with 3d (10 µM) for the indicated times, and GADD34 mRNA levels were analyzed by qRT-PCR. Results are the means of 4 replicate wells and are representative of 3 independent experiments. *P < 0.05 by Student’s t-test compared with DMSO-treated cells. (D) HCC-1806 cells were treated with 3d (10 µM) or tunicamycin (Tm, 1 µg/mL) for the indicated times. XBP1 mRNA levels were analyzed by RT-PCR and the products were resolved by agarose gel electrophoresis. The full-length (unspliced, XBP1u) and spliced (XBP1s) forms of XBP1 mRNA are indicated. GAPDH mRNA was used as an internal control. (D’) Quantification of data shown in (A) by densitometry. The percentage of XBP1s relative to total XBP1 was calculated as: (XBP1s/[XBP1s+XBP1u]) × 100%. The data shown are representative of 3 independent experiments. (E) HEK293 cells stably expressing CHOP-Luc, ERSE-Luc, or UPRE-luc reporters were treated with DMSO, 3d (10 µM), or Tm (1 µg/mL) for 24 h, and luciferase activity was measured using the Bright-Glo assay. Results are the means of 4 replicate wells and are representative of 3 independent experiments.

