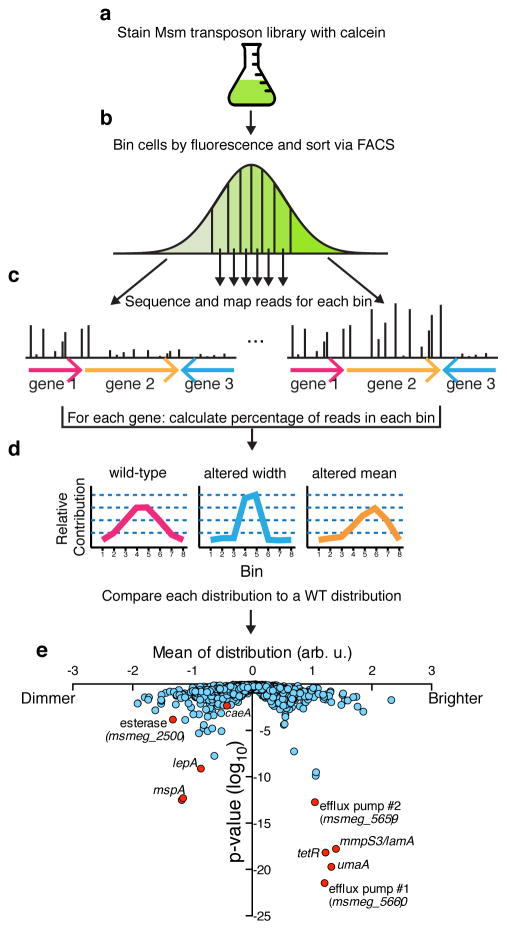
Figure 2. Screen for mutants altered in calcein distribution.
a, An Msm transposon library is stained with calcein AM b, and 1,200,000 cells are sorted into 8 bins by FACS, with each bin representing 12.5% of the population. c, Each of these binned libraries is deep sequenced and d, distributions are made for each gene that represents the fraction of reads in each bin for that gene. Below are cartoons of potential distributions that are analogous to an effective fluorescent distribution for a single mutant. e, For each gene or intergenic region the mean of the effective fluorescent distribution is determined and plotted against a Mann-Whitney U p-value, which is derived from comparing each gene’s distribution to a calculated wild type distribution. We picked 9 genes (shown in red) and made 8 gene deletions strains (Supplementary Table 2).

