
Figure 4. LamA creates asymmetry in polar growth and is a member of the divisome.
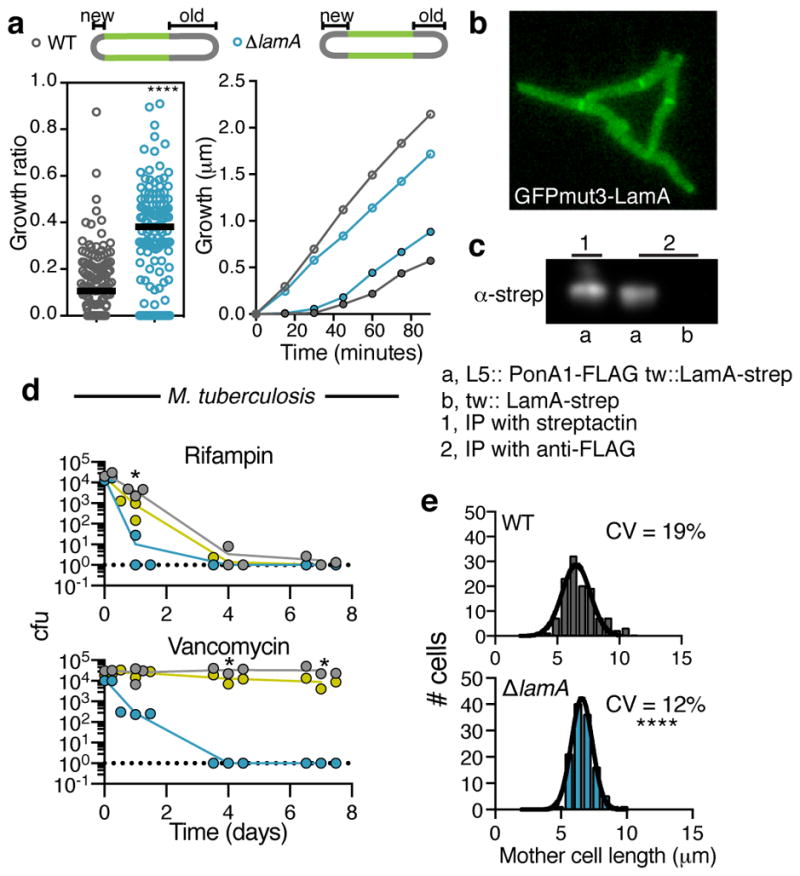
a, Using a pulse-chase experiment with an amine reactive dye as described in ref. 2 the amount of growth at the new and old poles is measured over the duration of the cell cycle. left panel: The ratio of growth (new pole/old pole) for single cells (n=137 cell for WT; n=125 cells for ΔlamA; dark black lines represent medians; the absolute values are shown in Extended Data Fig 6a). right panel: Using the same pulse chase experiment, growth is followed after septation at finer time increments. Time refers to the time after septation. (Old pole= open circles; New pole = closed circles; points represent averages of 20 cells). b, A representative image at a single time point of GFPmut3-LamA in WT Msm cells. Data was recorded for ~100 cell at t=0. c, α-strep western blot of immune-precipitates by indicated method (streptactin or anti-FLAG). Pull-down with α-FLAG was performed twice and LamA-strep was seen both times. a,b are different strains with ponA1-FLAG or lamA-strep integrated at the indicated phage sites (L5 or tweety (tw)). d, Survival of WT Mtb (grey), ΔlamA (blue), and complemented strain (yellow) is measured over time in the presence of 0.3 μg/ml rifampicin or 4 μg/ml vancomycin for 3 biological replicates. (Dotted line represents limit of detection; *p<0.05 by student’s t-test in comparison to WT) e, The distribution for the length of cells just prior to division (mother cells) for WT (n=120) and ΔlamA (n=120) cell. (For a,e **** p<0.0001; by a two-sided student’s t-test with Welch’s correction to compare either mean (a) or variation (e)).