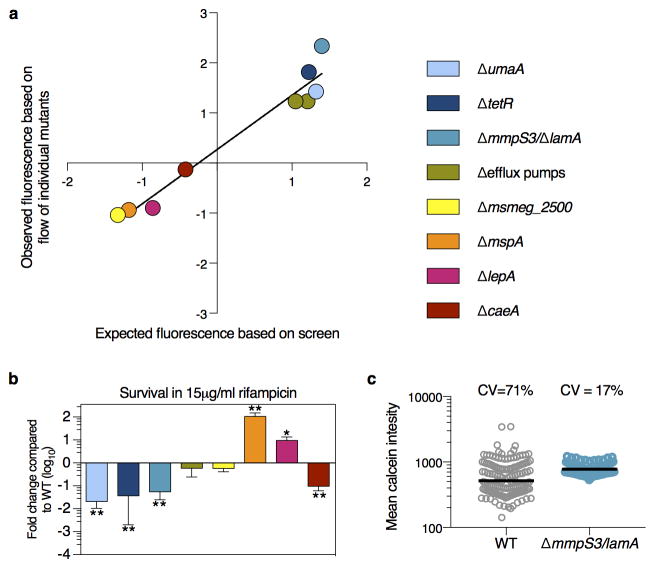
Extended Data Figure 1. Validation of screen and identification of mutant with decreased heterogeneity.
a, The average of 3 biological replicates of the 8 gene deletion strains is stained with calcein and analyzed by flow cytometry. The median of the each strain’s distribution (in units of wild type standard deviation) is compared to the value expected from the screen (slope = 1; R2 = 0.95; error bars represent s.d. assuming independence in the measurements of WT and mutant). b, Survival of 3 biological replicates of each strain is measured by plating and counting survivors after 42 hours in rifampicin treatment and compared to wild type (**p<0.01; *p<0.05, calculated by a two-sided student’s t-test in comparison to WT). c, The average fluorescence value of calcein-stained Msm cells measured by microscopy (n=147 for WT; n=174 for ΔlamA).

