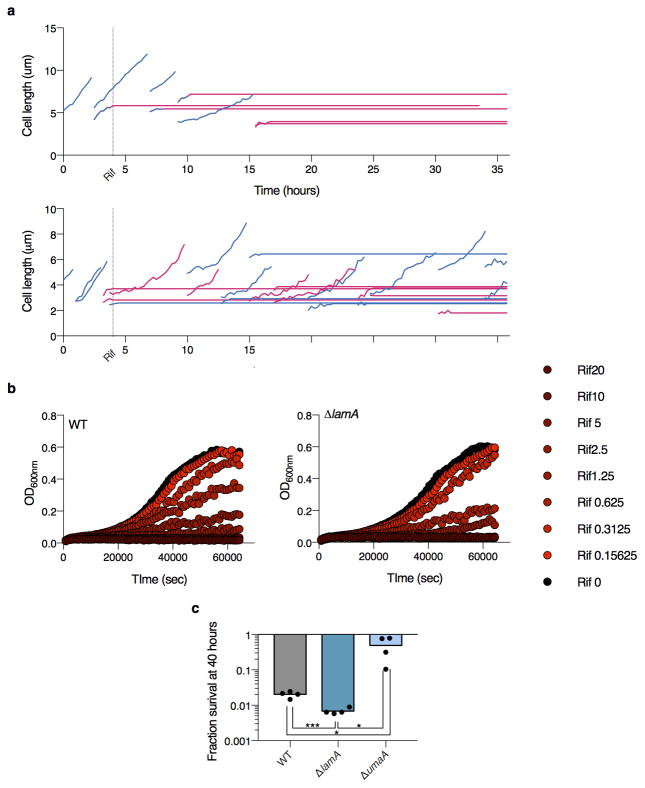
Extended Data Figure 2. Loss of lamA results in a more homogenous response to drug.
a, Two examples of growing lineages of WT Msm cells exposed to 5 μg /ml rifampicin. Blue indicate growing cells, pink indicates non-growing cells. The thick dotted line indicates the time rifampicin was added. Thin dotted lines represent division events. Data for ~100 of cells were recorded. The behavior of single cells was highly variable: many cells stopped growing immediately while others were able to grow and divide in a non-heritable manner. Bulk measurements were recorded in Figure 3d as a way of quantifying the variability over many more cells (~1M cells). b, The geometric mean of two biological replicates for WT and mutant Msm cells growing in sub-MIC concentrations of rifampicin. c, The mean survival of 4 biological replicates at 40 hours in rifampicin at normalized drug concentrations: WT=10 μg /ml; ΔlamA=5 μg /ml; ΔumaA =5 μg /ml.

