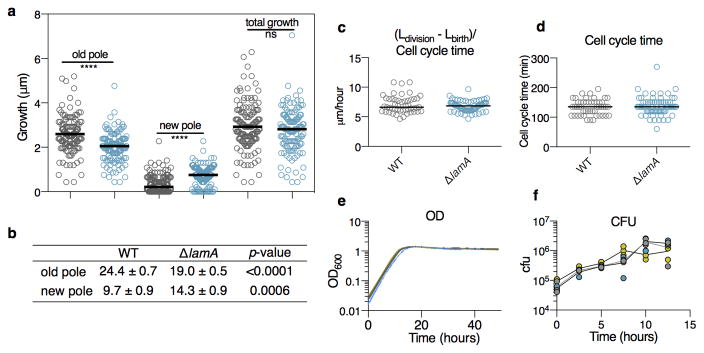
Extended Data Figure 4. Growth properties of ΔlamA cells compared to WT.
a, Using a pulse chase experiment as in Figure 4a, the amount of growth at the new and old poles (total growth = new pole + old pole) over the duration of a cell cycle is measured for both WT (grey, n=137) and ΔlamA (blue, n=125) cells. Dark black lines represent medians. b, Slopes were fitted to the data displayed in Fig. 4a. A p-value was calculated using a t-test to compare the slopes of WT and ΔlamA. Growth of WT (grey), ΔlamA (blue), and complement (yellow) as measured by c, elongation rate (n=49 for WT; n=71 for ΔlamA); d, cell cycle time (n=49 for WT; n=71 for ΔlamA). Dark black lines represent medians. c, colony forming units; and d, optical density are measured over time for 3 biological replicates.

