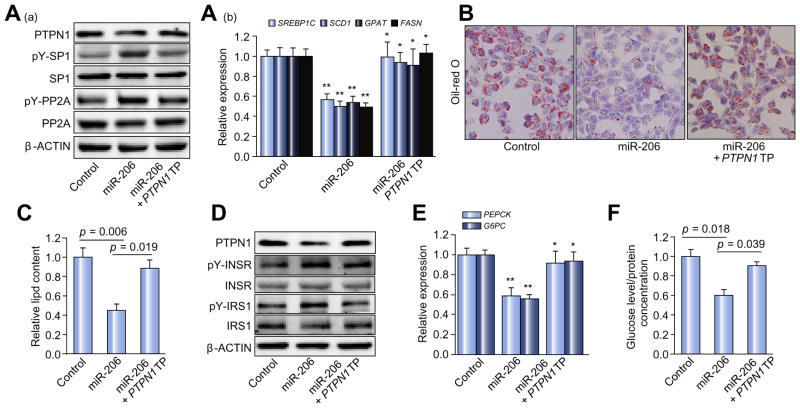
Fig. 3. Ptpn1 mediates the roles of miR-206 in facilitating insulin signaling and inhibiting lipogenesis simultaneously.
(A) (a) Western blot analysis of PTPN1, phosphorylated SP1, total SP1, phosphorylated PP2A, and total PP2A; and (b) mRNA levels of SREBP1C and the lipogenic genes including SCD1, GPAT, and FASN in three groups of HepG2 cells transfected with either MC-TTR-miR-206 (miR-206), a combination of MC-TTR-miR-206 and PTPN1 TP or MC-TTR-miR-206-MM (control). HepG2 cell were maintained on DMEM medium containing 0.5 mM oleate. (B) Oil-Red O staining of three groups of HepG2 cells. (C) Intracellular lipid content in three groups of HepG2 cells. (D and E) Protein levels of phosphorylated INSR, total INSR, phosphorylated IRS1, and total IRS1 as well as mRNA levels of the gluconeogenic genes including PEPCK and G6PC in HepG2 cells transfected with MC-TTR-miR-206, a combination of MC-TTR-miR-206 and PTPN1 TP or MC-TTR-miR-206-MM (control). HepG2 cells were kept in medium containing gluconeogenic substrates, 20 mM sodium lactate and 2 mM sodium pyruvate in the presence of 1 nM insulin. (F) Glucose levels in HepG2 cells treated with MC-TTR-miR-206, a combination of MC-TTR-miR-206 and PTPN1 TP or MC-TTR-miR-206-MM (control). Glucose concentration was normalized with cellular protein concentration. Data represent mean ± SEM. Student’s t test was used for statistical analysis. *p <0.05; **p <0.01.

