Fig. 3.

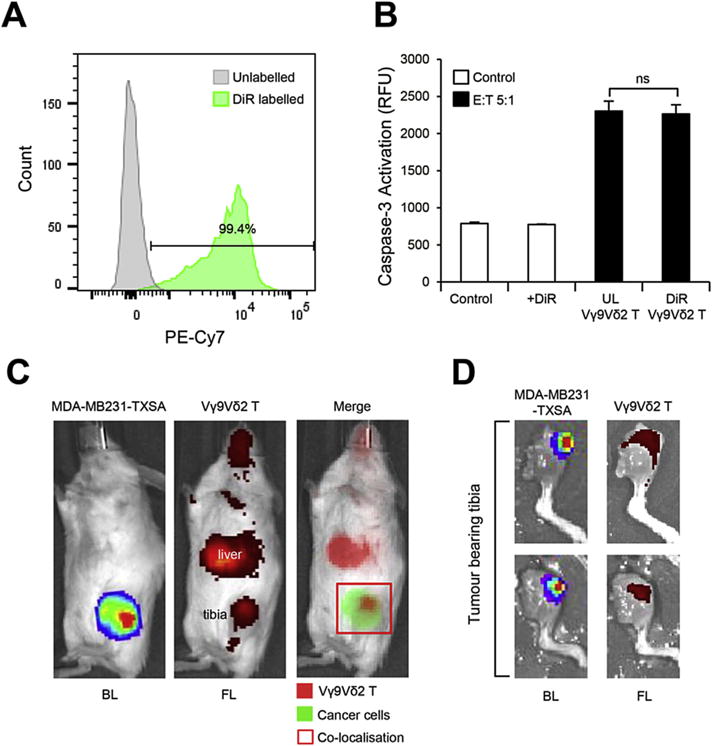
Fluorescently labelled Vγ9Vδ2 T cells localise to breast cancer lesions in the bone. Ex vivo expanded Vγ9Vδ2 T cells were labelled using DiR dye as outlined in the methods. A. Flow cytometric analysis of Vγ9Vδ2 T cell DiR labelling efficacy. B. Cytotoxicity of DiR-labelled and unlabelled Vγ9Vδ2 T cells against MDA-MB231-TXSA cancer cells (E:T, 5:1) as shown by caspase-3 activation. C. In vivo localisation of DiR-labelled Vγ9Vδ2 T cells injected via the tail vein into 5-week old female NOD/SCID mice bearing luciferase-tagged osteolytic breast cancer cells (MDA-MB231-TXSA) in the left tibia. Bioluminescence and fluorescence images were acquired on the IVIS Spectrum in vivo imaging system 24 h after infusion and D. ex vivo, 6 days after infusion (representative images of n = 5). UL = unlabelled, BL = bioluminescence, FL = fluorescence. Percentages shown indicate numbers from lymphocyte population. ns = non-significant (Student’s t-test, data represent mean ± SEM, n = 3).
