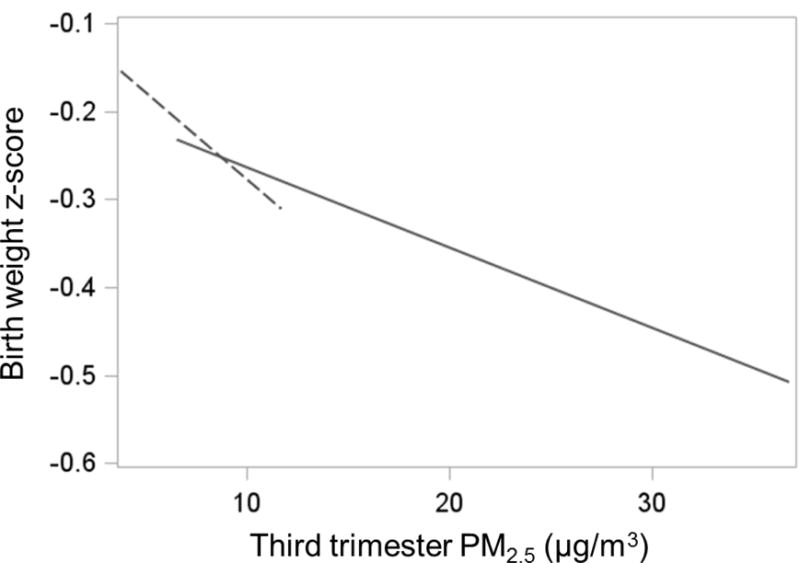
Figure 4. Site specific linear model within range of exposure: Cohort combinations based on log-linear models.

Birth weight z-scores were constructed from the residuals of the pooled analysis linear model that regressed birth weight for gestational age z-scores by maternal education, race/ethnicity, age, and pre-pregnancy BMI and the overall mean birth weight for gestational age z-score was added to the residuals. Dotted line depicts estimate for the PRISM study. Solid line depicts estimate for ACCESS and PROGRESS combined.
