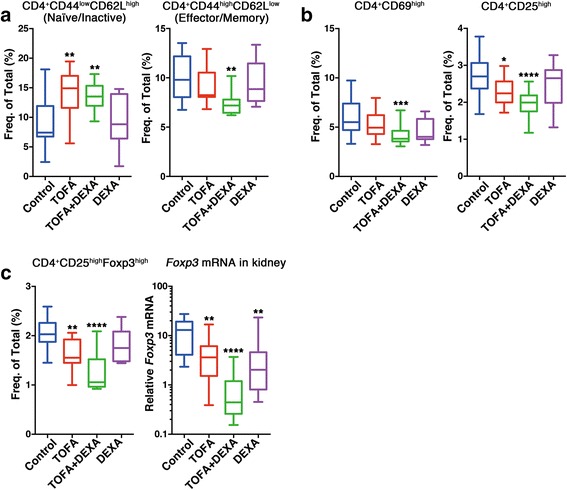
Fig. 3.

TOFA rebalanced immunocytes in BWF1. (a) Percentages of naïve/inactive T or TEM cells from each mouse group. (b) Percentages of CD4+CD69high or CD4+CD25high T cells from each mouse group. (c, left) Percentages of Treg cells from each mouse group. (c, right) Foxp3 expression in kidneys of BWF1. Each represents [TOFA (n = 13–15); TOFA + DEXA (n = 15); DEXA (n = 8); and control (n = 13–14)]. *p < 0.05, **p < 0.01, ***p < 0.001 and ****p < 0.0001 (vs. control mice). Freq. of Total (%): frequency of total splenocytes; TEM: effector/memory T; Treg: regulatory T
