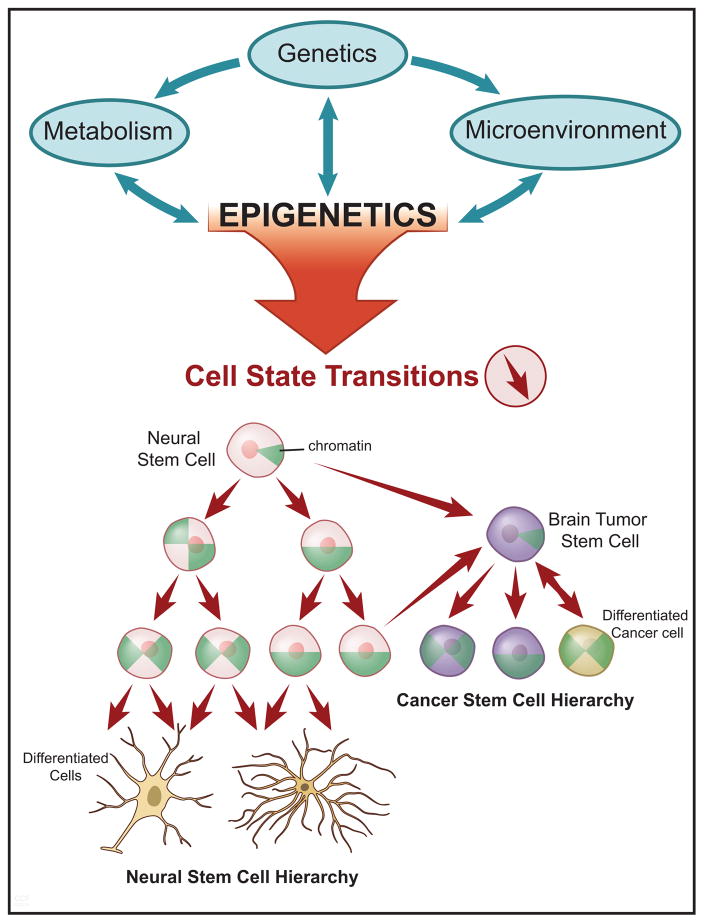
Figure 1. The Epigenetic Gateway to Cell Identity and Neoplastic Transformation.
A schematic depicting the genetic, metabolic, and microenvironmental interactions (green arrows) with epigenetic programs in cancer (top panel). In the lower panel, a diagram illustrating the cell state transitions (red arrows) influenced by altered epigenetic landscapes and their relevance to both normal neural stem cell, and cancer stem cell hierarchies (lower panel). Within the cells are green pie-shaped triangles, which represent the restructuring of chromatin architecture and progression towards closed chromatin in the most differentiated cell state.

