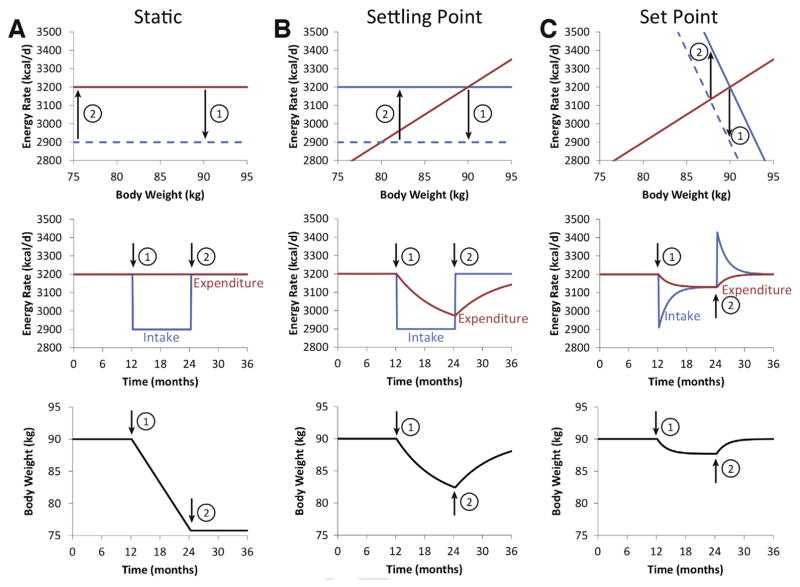
Figure 3.
Comparison of static, settling point, and set point models of body weight regulation in a simulated 90-kg man. (A) The static model assumes that energy intake (blue) and expenditure (red) are independent quantities that do not depend on body weight, as shown by the horizontal lines in the top panel. For the first year, energy intake and expenditure are assumed to be balanced and correspond to overlapping solid lines. At the end of the first year, the energy intake line is shifted downward by 300 kcal/d to the dashed blue line corresponding with the start of a weight loss intervention indicated by (1). Because energy expenditure is assumed to be constant, a constant energy deficit is achieved (top and middle panels) resulting in a linear rate of weight loss (bottom panel). At the start of the second year (2), the intervention is stopped and the dashed energy intake curve shifts back to the solid baseline intake line and weight loss is maintained. (B) The settling point model assumes that energy expenditure is an increasing function of body weight whereas energy intake is independent of weight (top panel). Shifting the intake curve down by the same 300 kcal/d after the first year (1) results in an energy deficit that decreases in proportion to weight lost (top panel) resulting in an exponential decay of the energy deficit over time (middle panel). Body weight falls according to a parallel exponential pattern and it takes years to reach a new equilibrium weight (bottom panel). At the beginning of the second year (2), the energy intake curve is shifted upward (top panel) and energy intake increases (middle panel), generating an energy surplus that results in an exponential pattern of weight regain mirroring prior weight loss. (C) The set point model assumes that both energy intake and expenditure are functions of body weight (top panel) and the same 300 kcal/d shift in the energy intake curve (top panel) results in an initial decrease in energy intake that subsequently exponentially increases (middle panel) as weight is lost and energy expenditure decreases. Body weight is lost in an abbreviated exponential pattern and achieves a new equilibrium after about 6 months and no further loss occurs despite the continued intervention (bottom panel). At the start of the second year (2), the energy intake curve shifts to baseline (top panel) and leads to transient hyperphagia (middle panel) and rapid weight regain (bottom panel).

